HEPCs Time lapse analysis by lens free microscope and the "Angiogenesis Analyzer"
This page in an extension of a work published in Stem Cell Research:
Ferratge S, Ha G, Carpentier G, Arouche N, Bascetin R, Muller L, Germain S, Uzan G. Initial clonogenic potential of human endothelial progenitor cells is predictive of their further properties and establishes a functional hierarchy related to immaturity. Stem Cell Res. 2017 May;21:148-159. Abstract.
This paper explores the in vitro functional capacities of endothelial cells derived from human circulating endothelial progenitor cells (Endothelial Colony Forming Cells, ECSFs). Two different origins was tested, umbilical cord blood (hCB) and peripheral adult blood (hAB), both containing rare cells (hCB-ECFCs and hAB-CFCs) which possess clonogenic and endothelial properties. Results show, among other, a relation beween the initial clonogenicity of hCB-ECFCs and hAB-ECFCs and their later angiogenic properties. Alonside to classical static tube formation analysis based on observation at 5 and 24 hours of culture in Matrigel, continuous recording (42 h) using lens free microscopy was performed for timelapse acquisition.
The principle of this observation method consists in holographic reconstructions of the diffraction pattern obtained by the device [1]. The software used for network detection and analysis, the Angiogenesis Analyzer was already used for HUVEC network analysis, first on simple images [2], and then in human umbilical vein endothelial cells culture (HUVEC) timelapse using lens free microscope [3].
HEPCs single image analysis
The following slide show gives an example of an unique image analysis with steps from the raw signal acquisition to the final cell network detection.
- Below: slideshow showing different steps from acquisition to analysis :
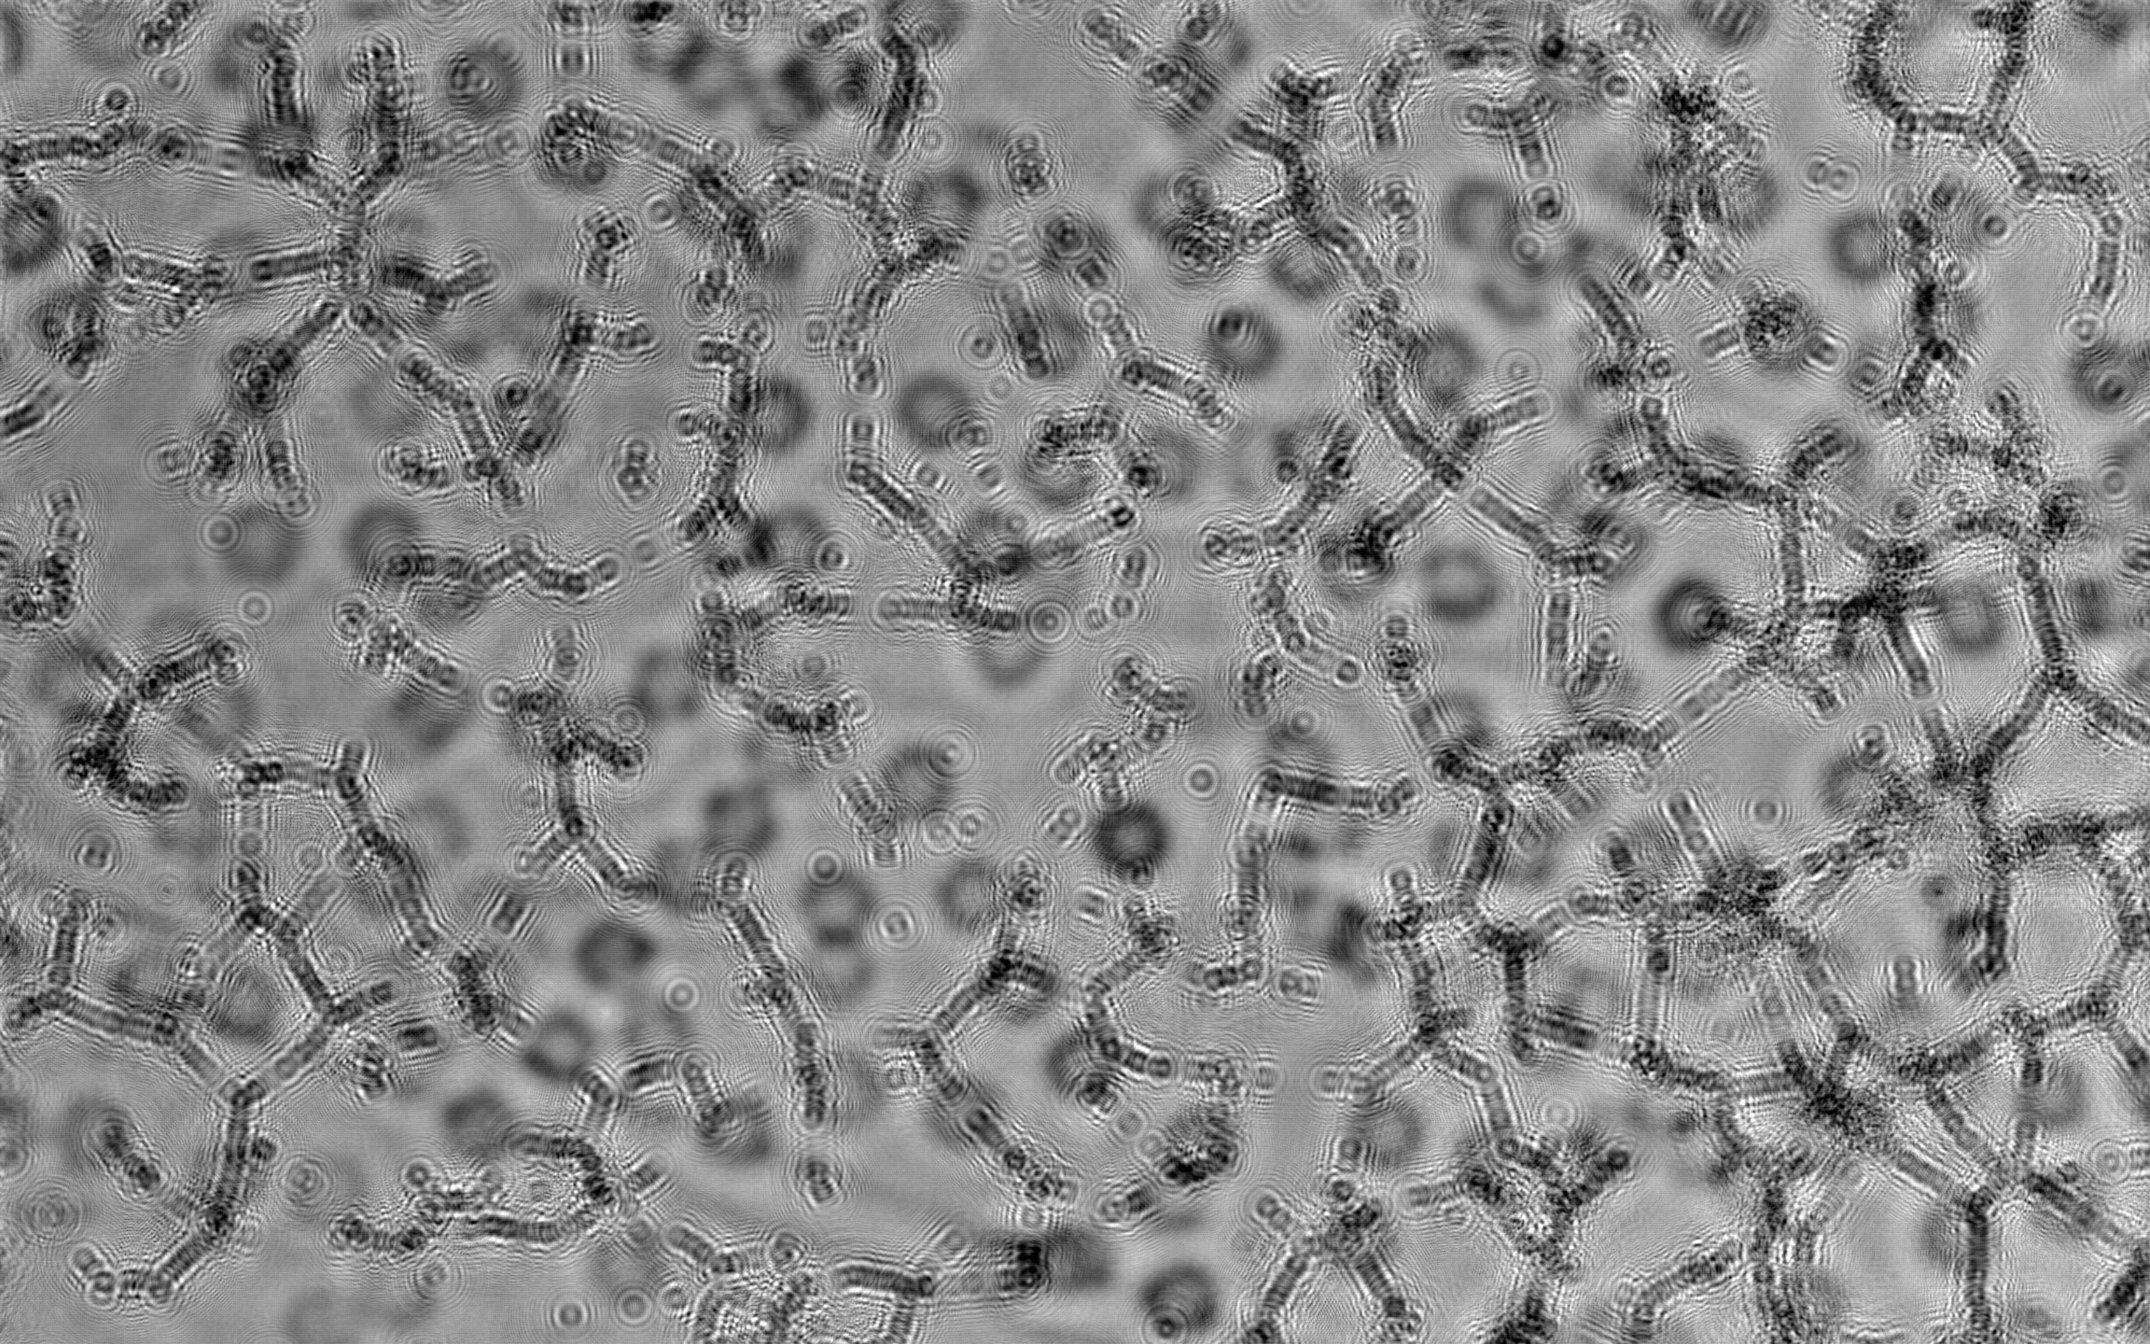
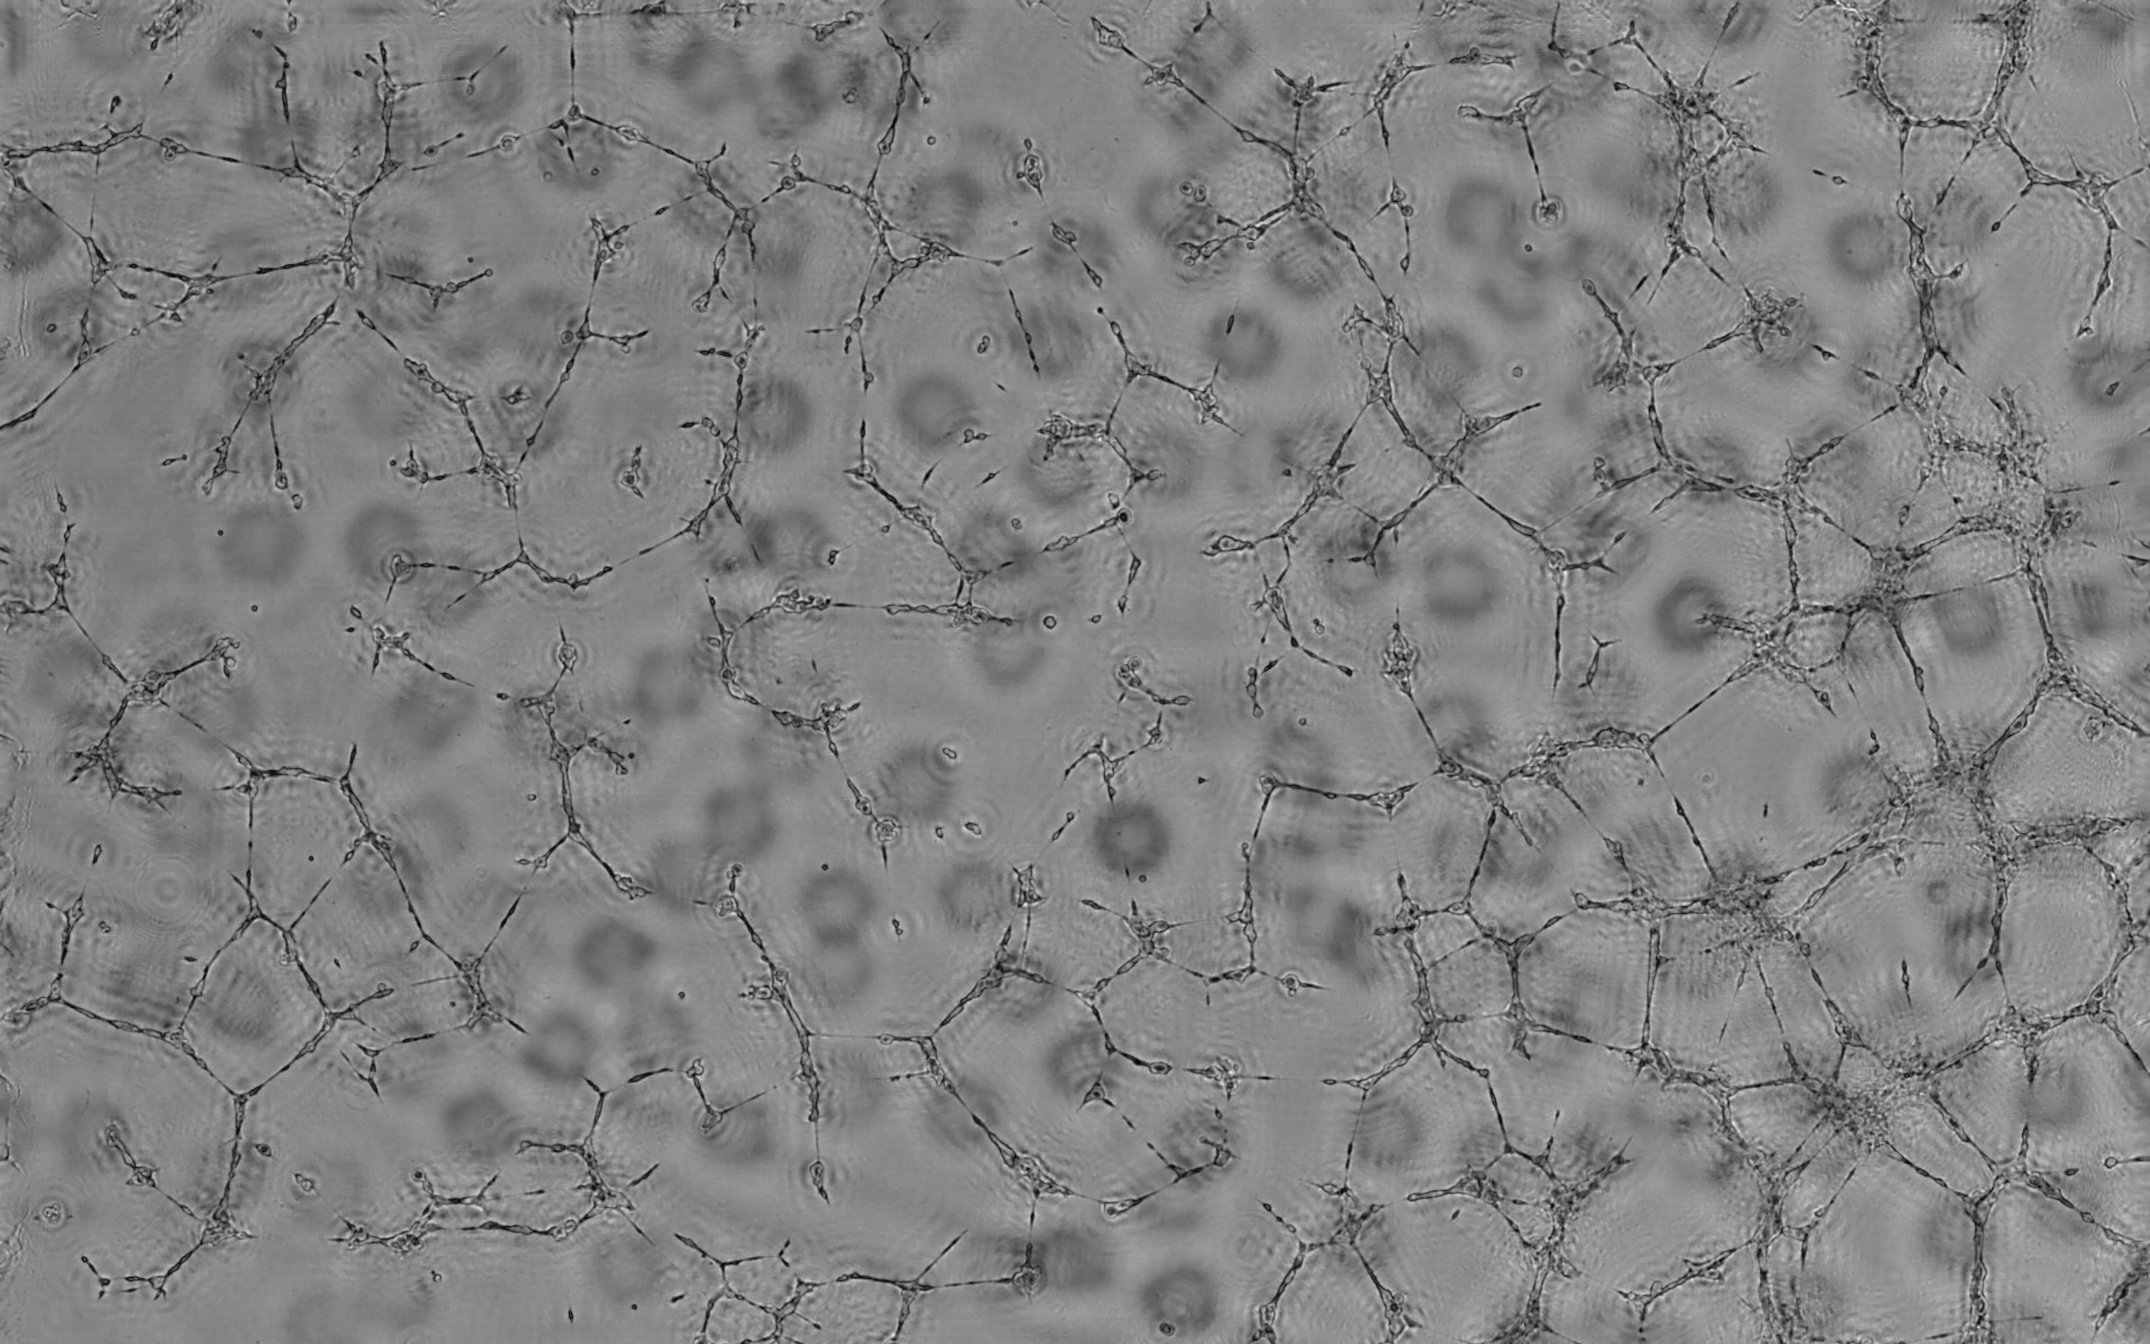
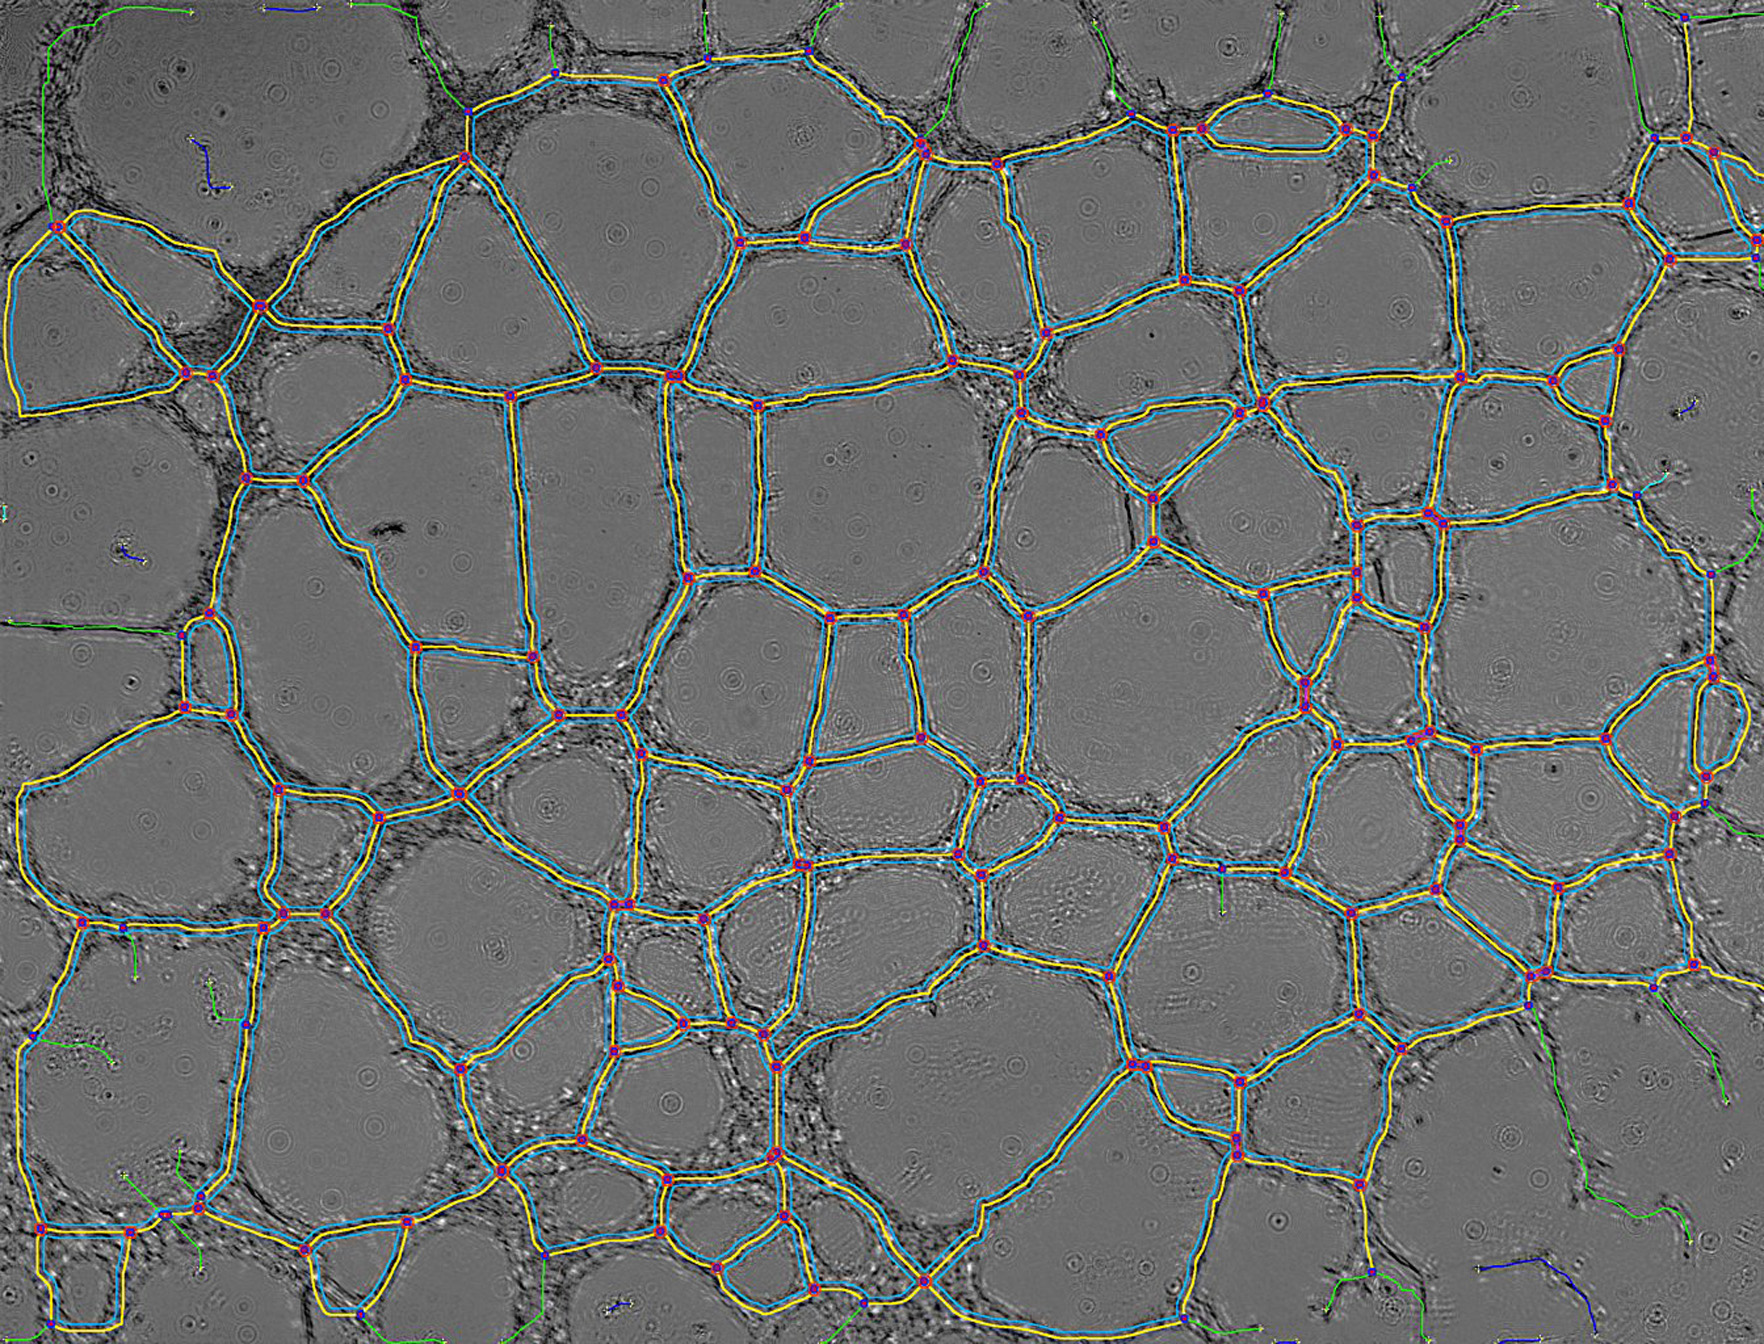
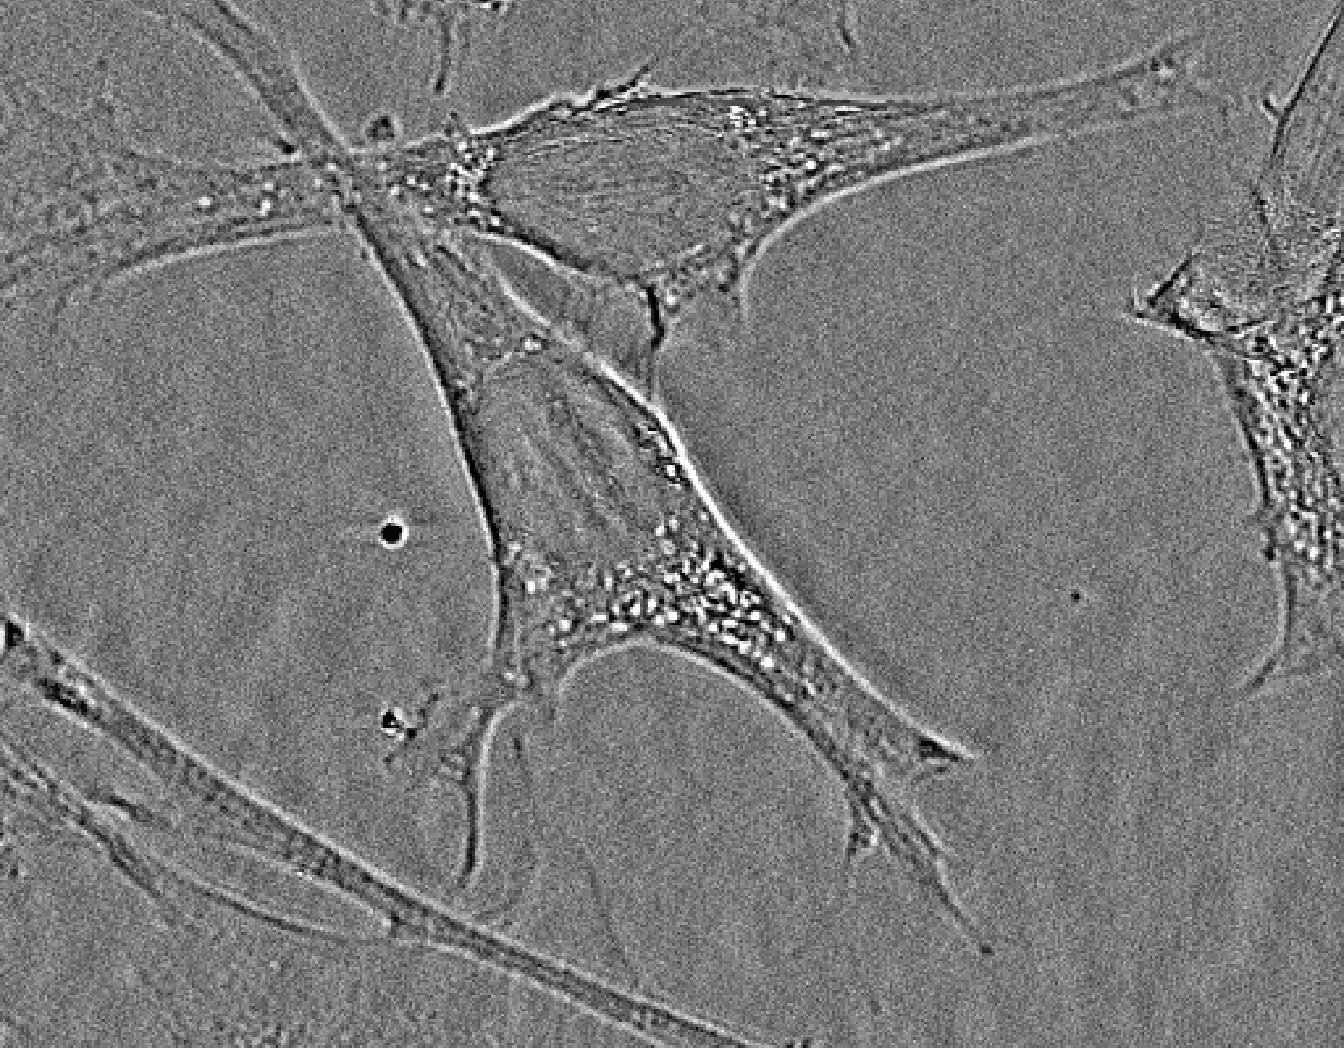
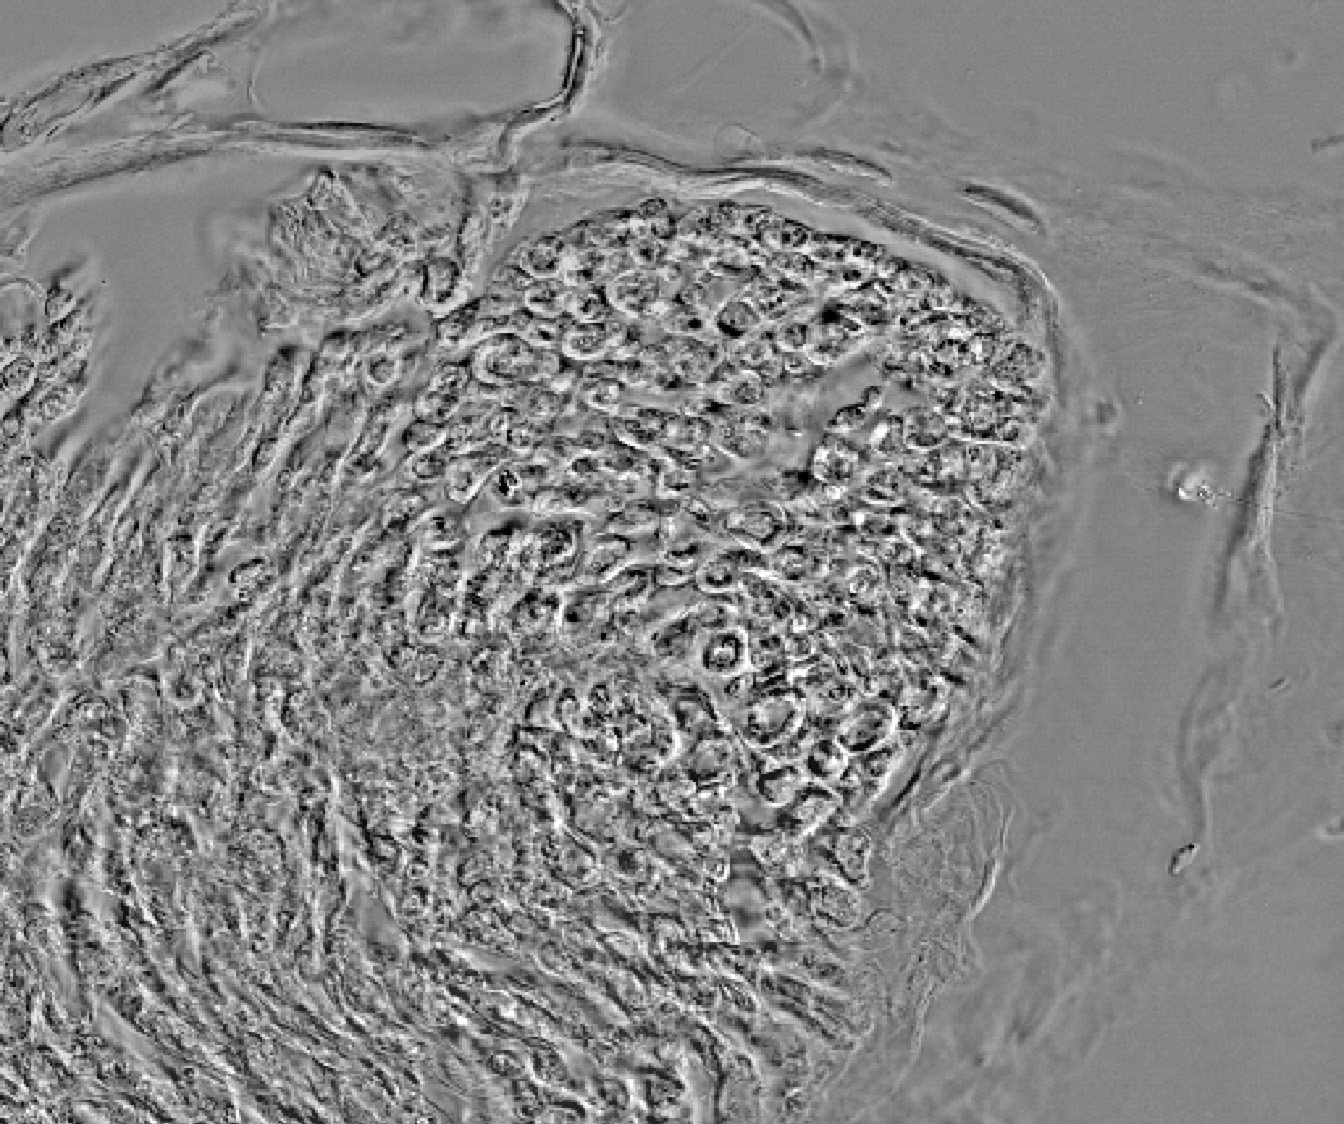
"hEPCs LFM image - raw" corresponds to the raw image without any treatment. "hEPCs LFM image - reconstructed" is the result of the hologram reconstruction.


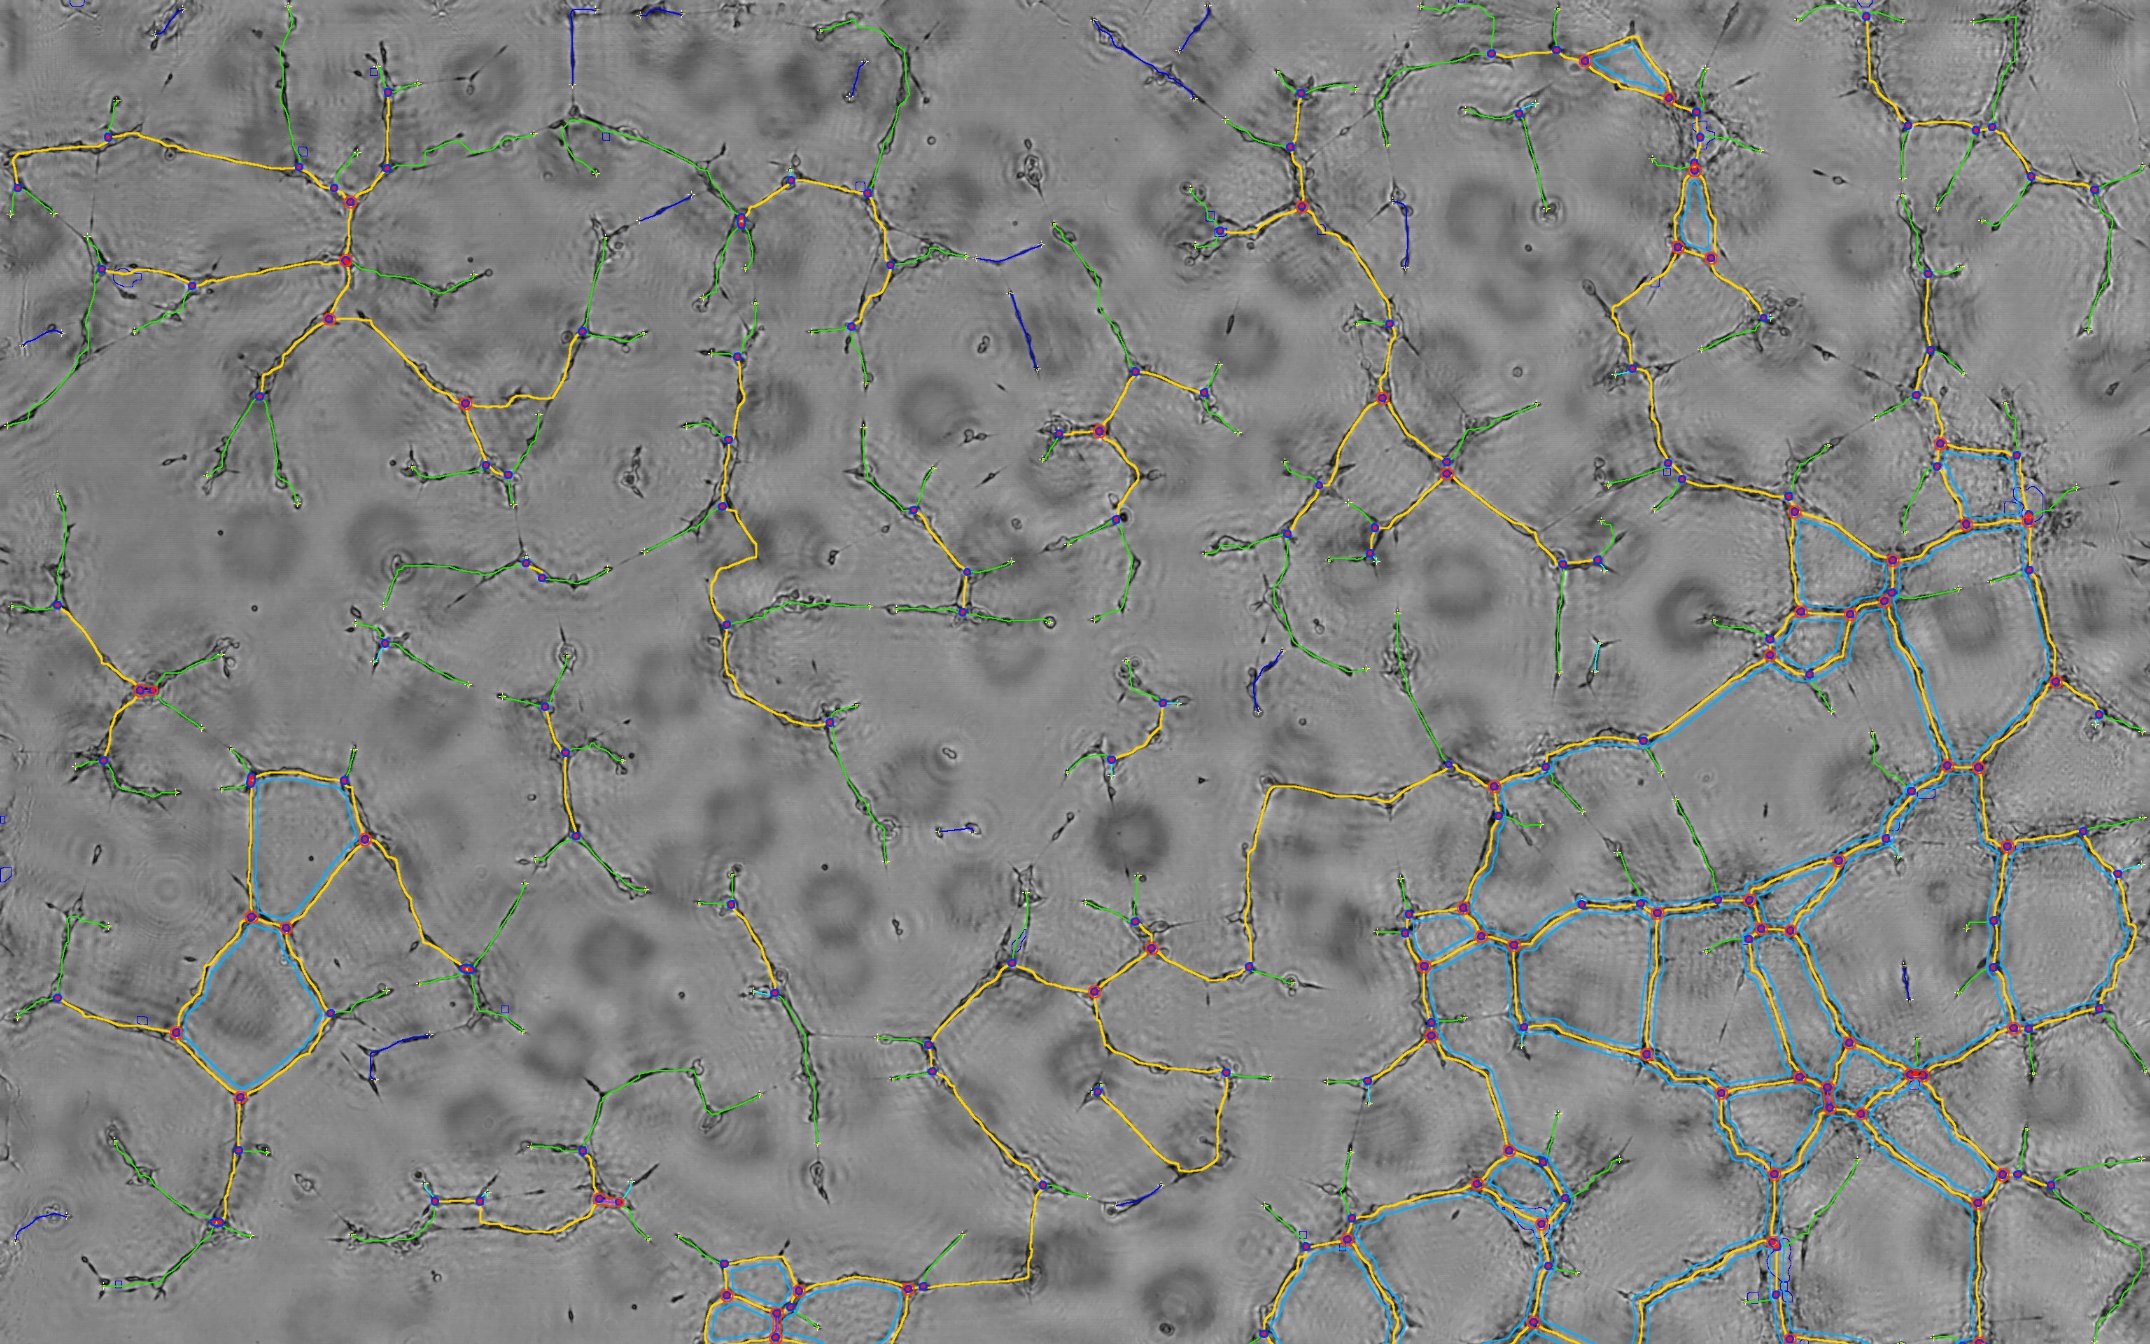
| prev | next | "hEPCs LFM image - reconstructed & analyzed" corresponds to the final result returned by the Angiogenesis Analyzer : segments are in yellow, branches in green. Red points surrounded by blue are junctions, junctions surrounded by red are master junctions, meshes (closed structures, made by so called tube-like-structures) are in cyan and isolated structures are in blue. Orange structures are master segments (see this link for precise definition of these elements).
HEPCs time lapse recording and analysis
For this test, three cell clone samples were cultured, two hCB-ECFCs samples, with low and "medium" clonogenicity, and one hAB-ECFCs sample presenting a lower clonogenicity than cord blood cells. Recording for 42 h were performed at 37°C, 5 % C02.
Video of composite raw image plus objects resulting from the analyses are shown below. Time lapse step is 15 min corresponding to 60x acceleration in the video. The image analyses corresponding to the first hour contain a lot of artifacts and are considered as non pertinent and have not been used.
- Below: movie showing a 42 h analysis of hAB-ECFCs cell culture":

Lensfree Angiogenesis Analysis of hAB-ECFCs - hight resolution
Lensfree Angiogenesis Analysis of hAB-ECFCs - low resolution (smartphone, iPad...)
- Below: movie showing a 42 h analysis of hCB-ECFCs cell culture with low clonogenicity:

Lensfree Angiogenesis Analysis of hCB-ECFCs « low clonogenicity » - hight resolution
Lensfree Angiogenesis Analysis of hCB-ECFCs « low clonogenicity » -
low resolution (smartphone, iPad...) - Below: movie showing a 42 h analysis of hCB-ECFCs cell culture with "medium" clonogenicity:
Lensfree Angiogenesis Analysis of hCB-ECFCs « medium clonogenicity » - hight resolution
Lensfree Angiogenesis Analysis of hCB-ECFCs « medium clonogenicity » -
low resolution (smartphone, iPad...)
Quantification with the Angiogenesis Analyzer
- Global evolution of the network structure during culture time:
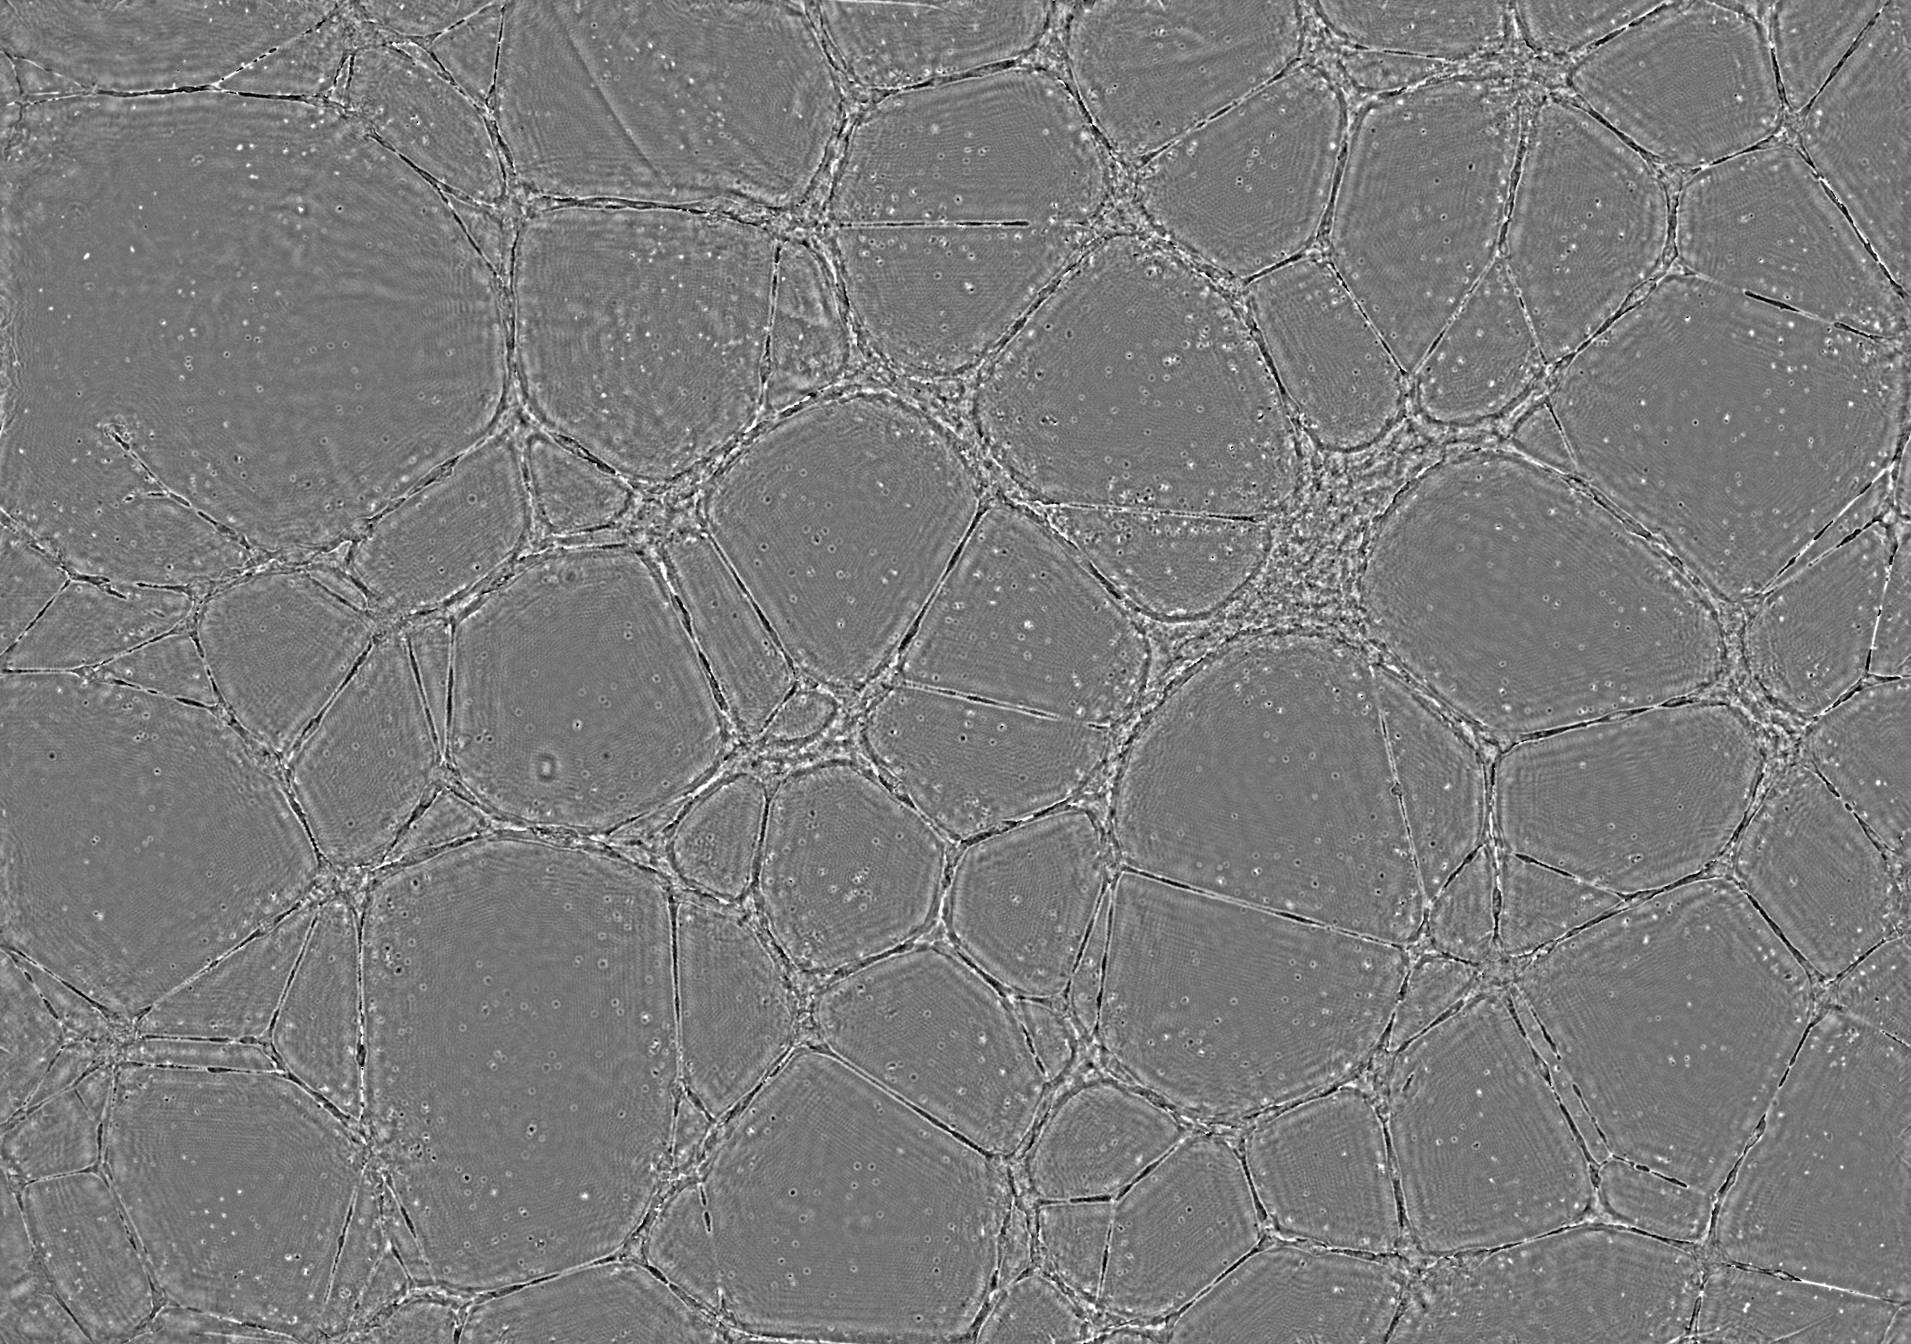
Network evolution is characterized by a fast meshing occuring in the first two hours. At this step meshes are small, with thick "walls" containing numerous cells and the cultures present large cell islets. Then, the number of meshes decreases quickly during the first six hours, during which they fuse and grow. This decreasing of complexity can be measured by the density of master junctions. Below, note the inflexion around 6 hours of culture (blue curve, master junction density), concomitantly to a logic increasing of mean mesh size (red curve). After this step, meshes continue to grow and fuse slowly nearly linearly from 20h.
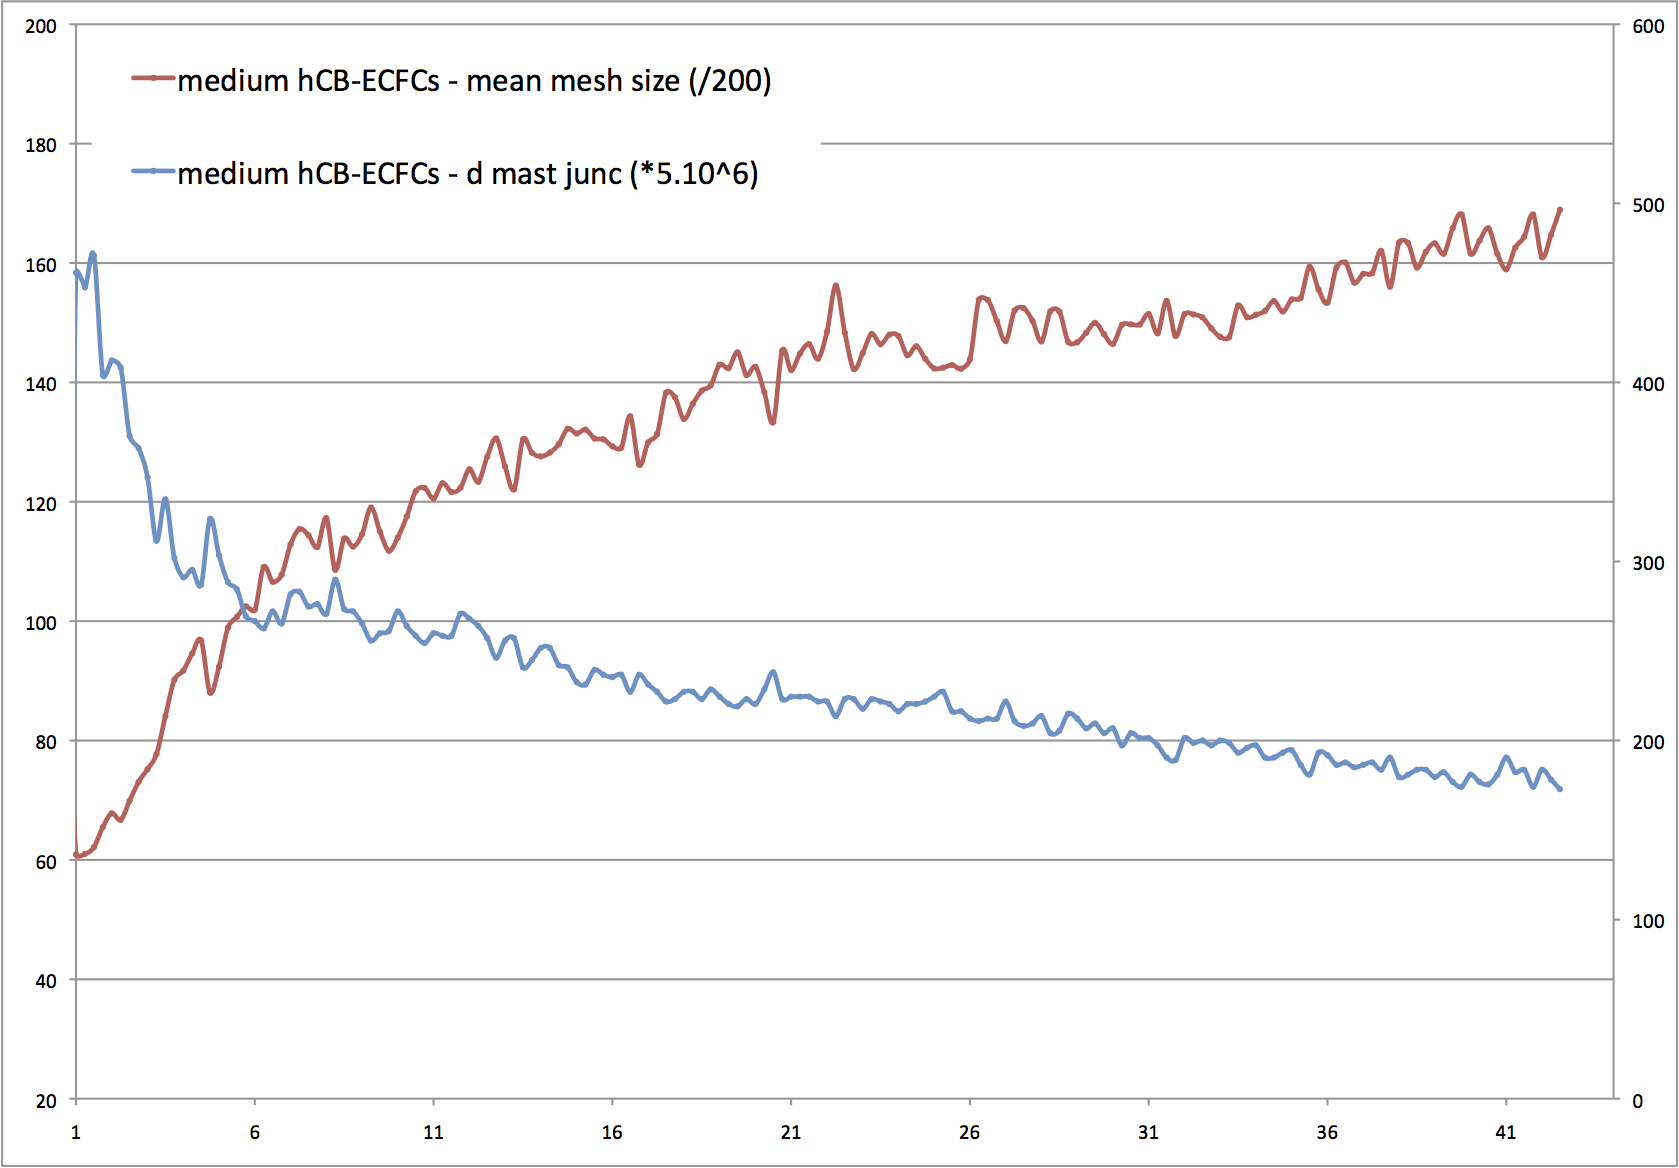
Master junction density and mean mesh size évolution:
X axis; time in hours, left Y-axis; master junction density (master junction number/analyzed
area (pixels) * 5.10^6), right Y-axis; mean mesh size (mean mesh size (pixels) * 200)
- Evolution of three parameters during culture time:
Among the parameters measured by the software, we focus on the next graphs on a wildely used in the literature, the mesh size, and the two more elaborated (and also specific) of the Angiogenesis Analyzer: the master junction density and master segment length. Total branching length was not used since it is not directly in relation with the organisation of the network. Each graph corresponds to one parameter for the three cell samples.
For the three cell samples, we observe a common fast and dense meshing establishment following by a decreasing of mesh number and an increasing of mesh size. The following graph shows the mean mesh size evolution. We can see that the mesh size increases less faster in hAB-ECFCs during the six first hours. After this step, the more clonogenic hCB-ECFCs keep more numerous meshes over time compared to low clonogenic hCB-ECFCs and hAB-ECFCs.

Mean mesh size evolution: X axis; time in hours, Y-axis; mean mesh size
(mean mesh size (pixels) * 200)The irregularities of the "mean mesh size" curve (graph above), especialy in the hAB-ECFCs one, reveal network instability as we can visually note in the video last third party. Discontinuities of the curve reveal network and meshes instabilities, leading to segment disruptions, and so brutal disappearing of the most mature meshes - the biggest ones - which is compensated after by small residual meshes growing. Interestingly, the cells possessing the highest clonogenicity (green curve), exhibits the better network stability.
The next graph below, presenting the "mean master segment length" evolution, shows the same profile, but more stable, less sensitive to mesh disruption. This makes a good indirect indicator of the mesh size evolution, and of the global network stability.

Mean master segment length evolution: X axis; time in hours,
Y-axis; mean mast set length (pixels)The next graph exhibits the evolution of the "master junction density". Junction spatial density logically follows the inverse progression than the mesh size. This parameter is strongly stable, very little sensible to mesh disruptions making it an ideal criterion for network complexity development monitoring.

Master junction density evolution: X axis; time in hours, Y-axis;
d mast junc (master junction number/analyzed area (pixels) * 5.10^6)
Conclusion
This dynamic analysis by time lapse image acquisitions gaved indications going in the same direction than the results presented in the paper. These analysis show the interest to use "master segments" and "master junctions" parameters to follow over time the meshed organisation of endothelia cell cultivated in vitro in Matrigel. Associated to "mean mesh size", they can reveal some aspect of the network stability and morphology. "Mean mesh size" is optimal to look for network stability. "Master junction density" criteria is indicated for global complexity analysis of the meshed organisation while "mean master segment length" is a compromise between the two first parameters.
From the biological point of view, this experiment confirms a relation between clonogenicity of cells and their capacities to make network in vitro: the less clonogenic cells gives the less stable network, with the fastest mesh size growing. Interestingly hAB-ECFCs cells present furthermore a slowest network organisation in precocious steps of the culture than the hCB-ECFCs.
Concerning the method of image acquisition, regarding to theses data it turns out to be a powerful tool, low-cost without requiring any intervention or settings during culture, to finely study endothelial cell properties.
Collaborations

![]() Ségolène Ferratge, Dr. Fabien Chevalier and Dr. Georges Uzan. INSERM U1197, Hôpital Paul Brousse, Villejuif. France.
Ségolène Ferratge, Dr. Fabien Chevalier and Dr. Georges Uzan. INSERM U1197, Hôpital Paul Brousse, Villejuif. France.
![]()

![]() Dr Cédric ALLIER. CEA-Leti - MINATEC Campus, Grenoble, France.
Dr Cédric ALLIER. CEA-Leti - MINATEC Campus, Grenoble, France.
![]()

![]() Geoffrey Estaban. IPRASENSE, Cap Alpha, Clapiers, France. www.iprasense.com [1].
Geoffrey Estaban. IPRASENSE, Cap Alpha, Clapiers, France. www.iprasense.com [1].
![]()