Table of contents
- Description, p1
- Installation, p2
- Documentation, p3
- Tutorial, p4
- Tutorial - build a composite, p4
- Tutorial - adjust levels (...), p4
- Tutorial - adjust levels (...), p4
- Tutorial - Range image (...), p4
- Video Tutorials, p5
- References, p6


Tutorial:
These examples illustrate the typical steps proposed with this toolset to build, visualize and adjust multichannel images and multidimensional stacks LUT histograms. The original files are downloadable for training from the "On Line Documentation & Demo" menu tool.
Tutorial - build a composite image from single channel images:


- Download the demo Images by the "On Line Documentation & Demo Menu" -> "Download 3 Single-Channel Images" menu .
 The tool downloads and opens three images stored as a stack on the hard disk at the ".../ImageJ-64/Downloaded Demo Images/" repertory [2].
- Select the "Multi-Channels Stack From Single Channel Files" function from the "Stacks Menu Tool".

- Choose the color atributes for each channel in the "Merge Channels" dialog box , and check the option "Create composite" :

 Above the result. See below to handle this kind of window.
- Download the demo Images by the "On Line Documentation & Demo Menu" -> "Download 3 Single-Channel Images" menu .
Tutorial - adjust levels of a multichannel stack:

- Download the demo image by the "On Line Documentation & Demo Menu" -> "Download a Multi-Channel Stack" function:

The tool downloads and opens a stack of three slices stored on the hard disk at the ".../ImageJ-64/Downloaded Demo Images/" repertory. - Step 1 - Choose the colors for the composite image from the "Make Composite" tool:
 The composite image returned, has a colored LUT for each channel which can be independently adjusted (below).
 The "Channels Tool" dialog box is open and allows some manipulations of the channels (see the ImageJ documentation). The next step proposes some standard automatic adjustments.
- Step 2 - Optimize the visualization by activating some options of the "Adjust Channel Levels" menu tool:
 While images acquired with a depth of 8 bit can be seen in full
dynamic on a screen, a higher sampling of the signal requires a careful
choice of the levels that are displayed on the 256 levels of a monitor, especially when the relatives levels between channels or images must be
kept. He are 3 different ways to obtain a fast automatic setting. These settings which target the individual look up table of each channel, are non destructive for the initial image data.
While images acquired with a depth of 8 bit can be seen in full
dynamic on a screen, a higher sampling of the signal requires a careful
choice of the levels that are displayed on the 256 levels of a monitor, especially when the relatives levels between channels or images must be
kept. He are 3 different ways to obtain a fast automatic setting. These settings which target the individual look up table of each channel, are non destructive for the initial image data.
- "10, 12, 15 and 16 bit sampling"
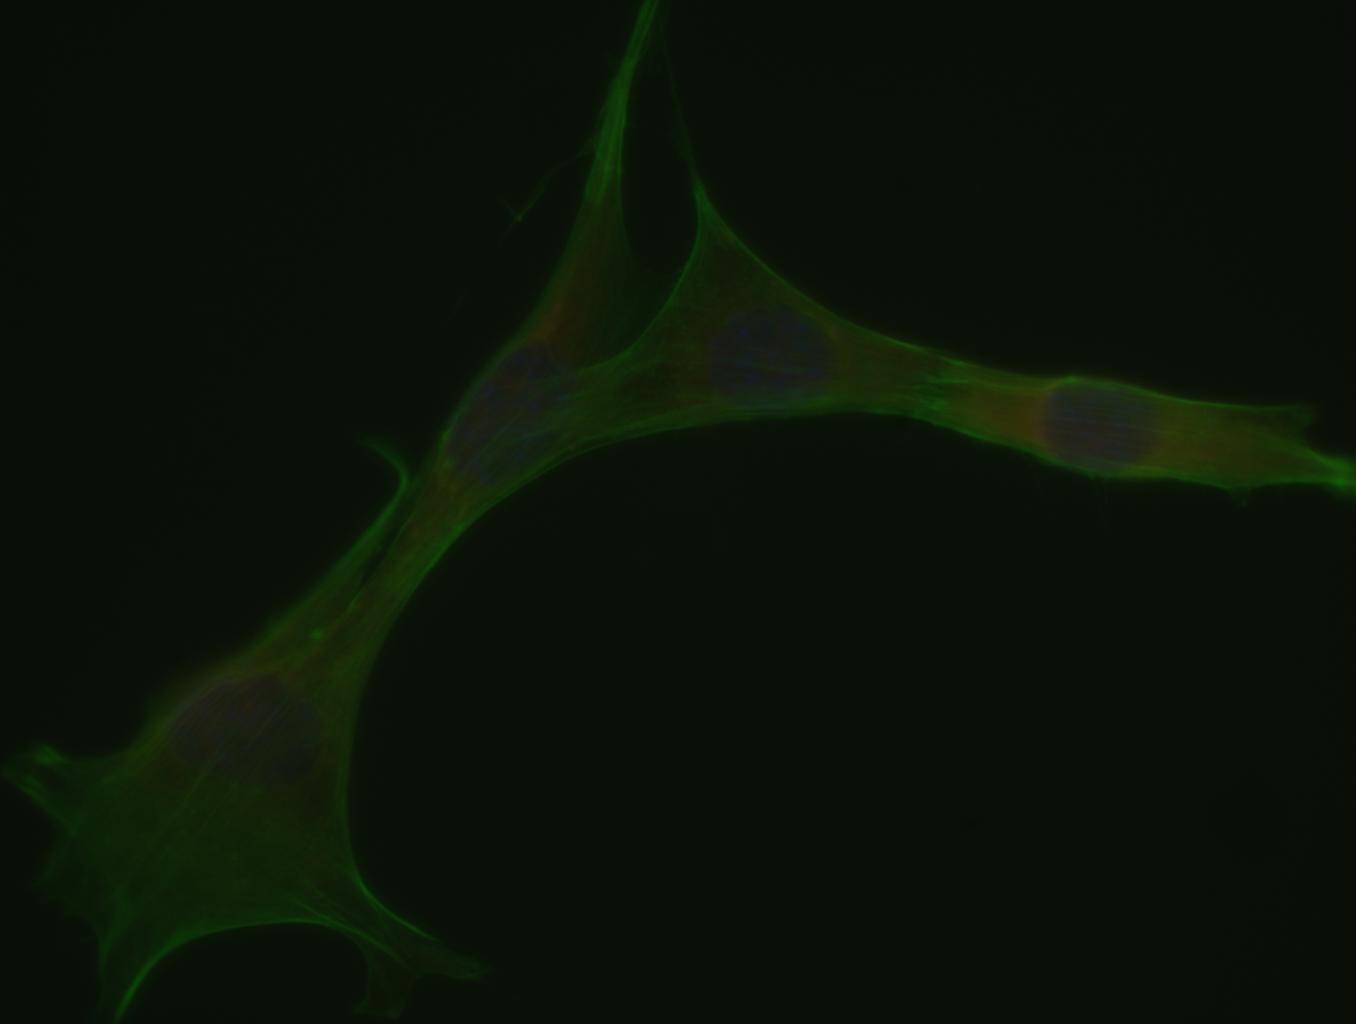
 allow to show each channel of a composite image according to the full sampling depth of the camera. Images acquired in 12 bits mode will be printed on the screen as a standard 8 bit image if the "12 bit sampling (0-4095)" option is chosen. The 4096 possible levels are so distributed according to the 256 levels of the screen. In the sample, acquired in 10 bits mode and brought by the acquisition software to 16 bits, the "16 bit sampling (0-65535)" option gives the following results (see the right figure). Note that in that case the aspect has not changed compared to the default printing of ImageJ (unsigned 16 bit range, automatic mode). The full scale image can be seen in the next slide show.
- => In which cases can we use this option ? When it is necessary to keep a semi quantitative information from the observations, when comparing a control labeling to a treated labeling, comparing an immuno-labeling to an antibody control etc. It also allows to restore the initial default settings after some manual level adjustment tests.
- => In which cases can we use this option ? When it is necessary to keep a semi quantitative information from the observations, when comparing a control labeling to a treated labeling, comparing an immuno-labeling to an antibody control etc. It also allows to restore the initial default settings after some manual level adjustment tests.
- "min->max all channels"
 looks for the higher level present in every slice (channel, z, t) and bring the screen printing of the composite image or stack between 0 and this value (right picture). In the sample, the maximal value can be found in the channel 2 (green) : 23103. The values comprised between 0 and 23013 are then distributed between 0 and 255 on the monitor. The full scale image can be seen in the next slide show.
- => In which cases can we use this option ? When it is necessary to improve the visualization while keeping the initial ratio between channels. Typically when the respective intensity of different labeling must be kept.
- => In which cases can we use this option ? When it is necessary to improve the visualization while keeping the initial ratio between channels. Typically when the respective intensity of different labeling must be kept.
- "min->max each channel"
 This function allows to make the equivalent of a histogram normalization on each channel, but reversible, and affecting only the LUT. The channels affected by the treatment may be chosen. The non-selected channel(s) can be scaled according to the bit depth or let in the state. This
can be useful to preserve a manual setting concerning one of the channels. The slide show bellow presents a sequence of treatment showing the effects of the different options. The picture (right) shows the result of a normalization of the 3 LUTs.
This function allows to make the equivalent of a histogram normalization on each channel, but reversible, and affecting only the LUT. The channels affected by the treatment may be chosen. The non-selected channel(s) can be scaled according to the bit depth or let in the state. This
can be useful to preserve a manual setting concerning one of the channels. The slide show bellow presents a sequence of treatment showing the effects of the different options. The picture (right) shows the result of a normalization of the 3 LUTs.

- => In which cases can we use this option ? When the visual colocation of the labeling must be improved without saturating the image.
- => In which cases can we use this option ? When the visual colocation of the labeling must be improved without saturating the image.
- Summary for the results of these options - slide-show:


| prev | next |
- "10, 12, 15 and 16 bit sampling"
- Manual color adjustment - "Adjust Min and Max" tool:
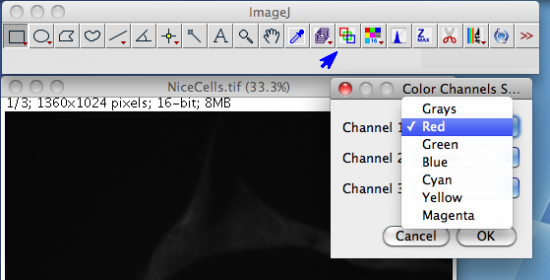
 This ImageJ’s tool permits an easy handling of composite image colors. Choose the channel to modify (below) - note the channel glider of the composite image which changes its position. The color of the channel is indicated in the image label and by the outline.
 Set with the "Minimum" and "Maximum" cursor the desired limits. In the following picture, the background is decreased by removing from the printing the pixels which level are comprised between 0 to 4401. The contrast in enhance by decreasing the maximum value to 17250.

- Download the demo image by the "On Line Documentation & Demo Menu" -> "Download a Multi-Channel Stack" function:
Tutorial - adjust levels of a composite Z stack:

- Download the demo stack by the "On Line Documentation & Demo Menu" -> "Download a Multi-Channel Stack" function.
 The tool downloads and opens a 4D stack of 51 slices stored on the hard disk at the ".../ImageJ-64/Downloaded Demo Images/" repertory [3].
- Step 1 - Choose the attributes of the 4D from the "Stack to Hyperstack" function:
 Organization of the stack: the acquisition software can use different organizations of the images in the exported "tif" stack. In the sample, 3 channels have been acquired in stacks of 17 z steps (0,5 µm by step). Once opened, the file appears as a stack of 51 slices in which we find in order, Green (z1->17) - Blue (z1->17) - Transmission (z1->17). In consequence the dimension setting is "xyzct" (next picture).

- Step 2 - Choose the color of the channels from the "Make Composite" tool:
 The colors green, blue and grey are chosen in the example.
- Step 3 - Adjust the levels of the channels from the "Adjust Channels Levels" tool:
 The 12 bit option is chosen to get a global visual aspect of the stack regarding to the full dynamic of the acquisition bit depth.
- Step 4 - Edit, make visible or not the channels :
At this step, there are two ways to remove the printing of a channel:
- By deactivating the concerned channel from the "Channels" tool window (uncheck, arrow 1 on the figure below).
- By removing the channel to erase by selecting it (glider position as pointed by the arrow 2 on the next figure, and using the "Remove Current Channel" tool (arrow 3).
 The second option has been chosen in the example (below).

- Step 5 - Get enhanced views :
A convenient way to get a document summarying a multidimensional observation consists in z projection. ImageJ can make a projection of composite images using the current LUTs as signal. First, optimize the stack LUTs by using the "Adjust Channel Levels" menu, choosing the "Min->Max each channel" method (picture below).

 Get a "Maximum" projection of the stack, by clicking on the "Z projection" Tool, as below:

- Download the demo stack by the "On Line Documentation & Demo Menu" -> "Download a Multi-Channel Stack" function.
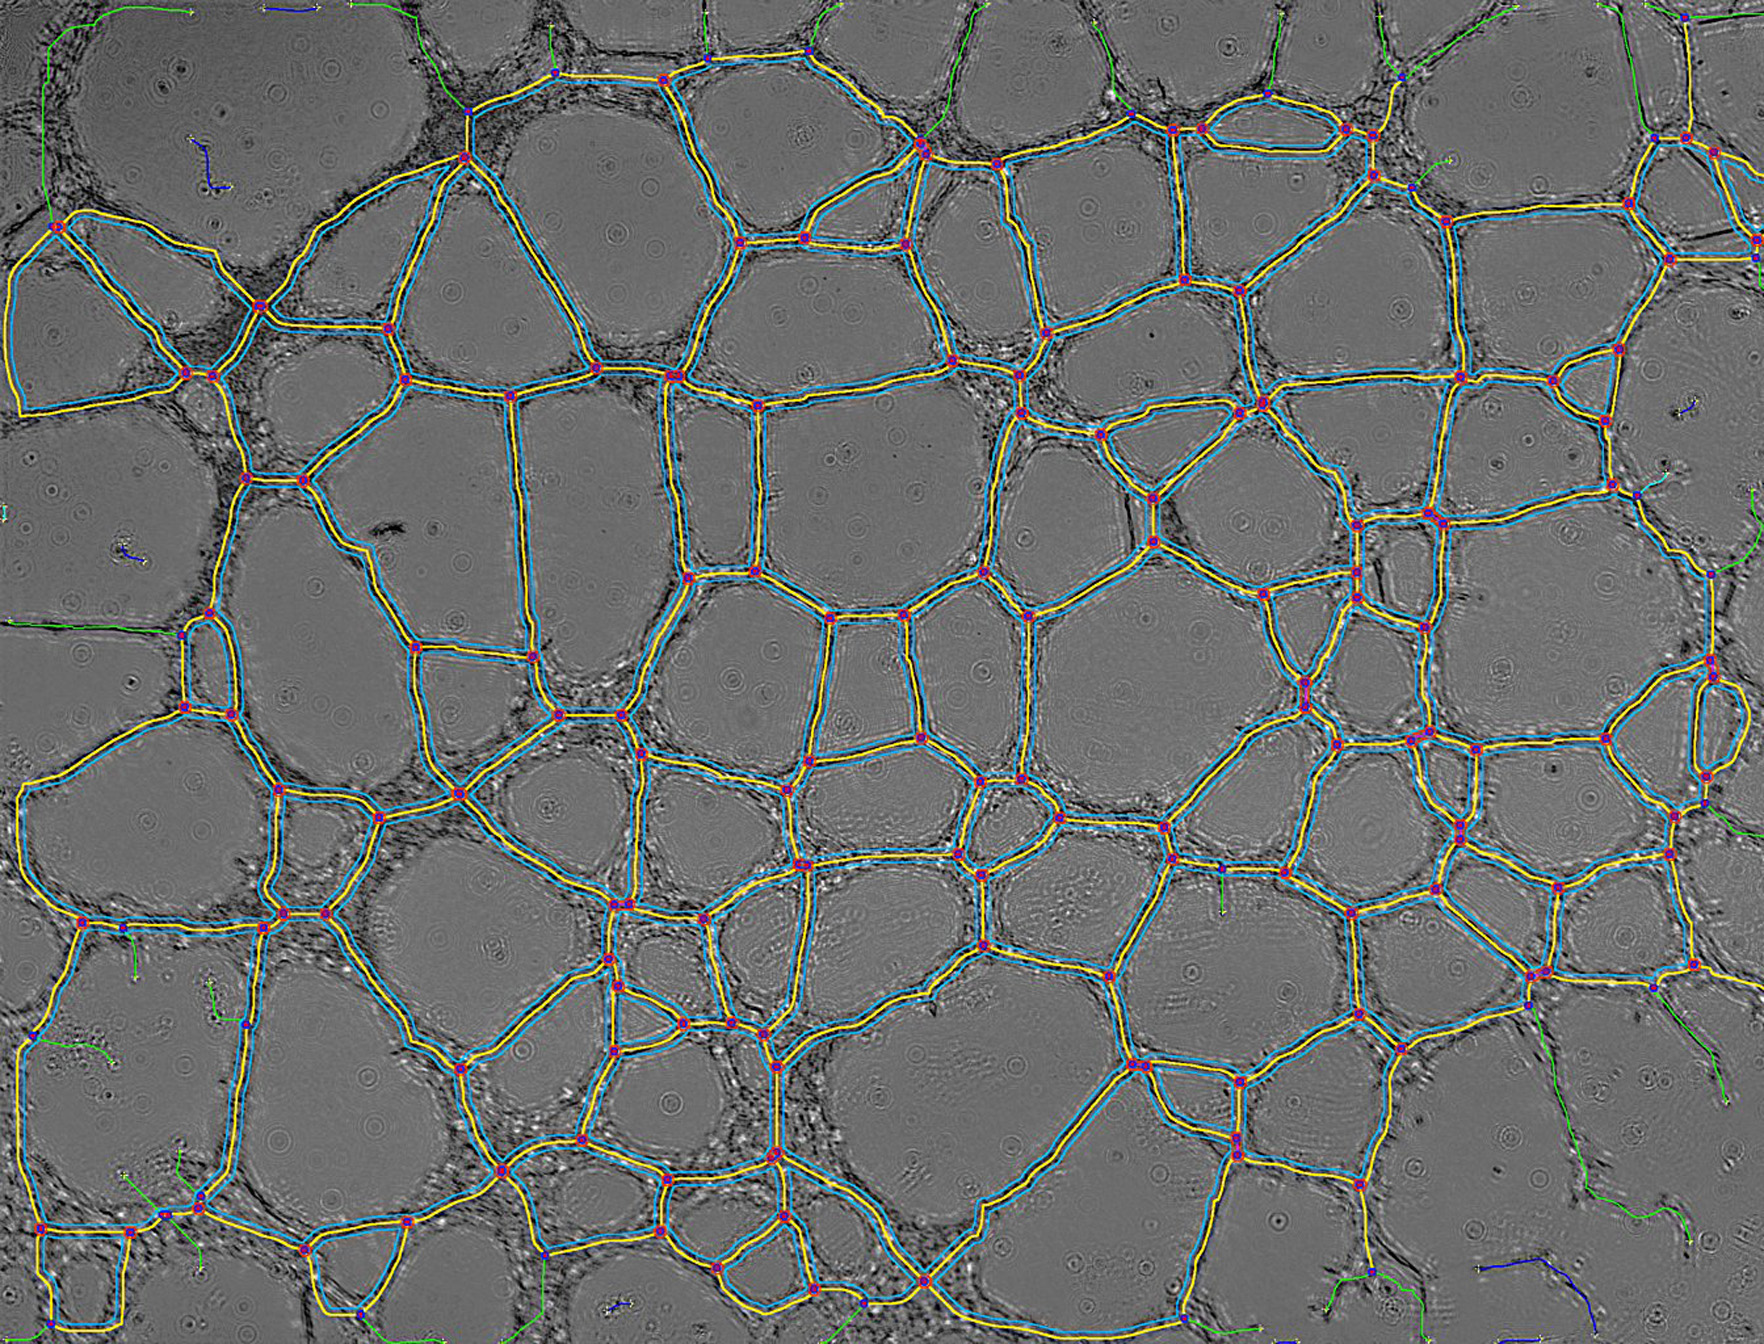
Tutorial - Range image color level between to values:

- Adjust Channel Levels Menu- "between two set values"
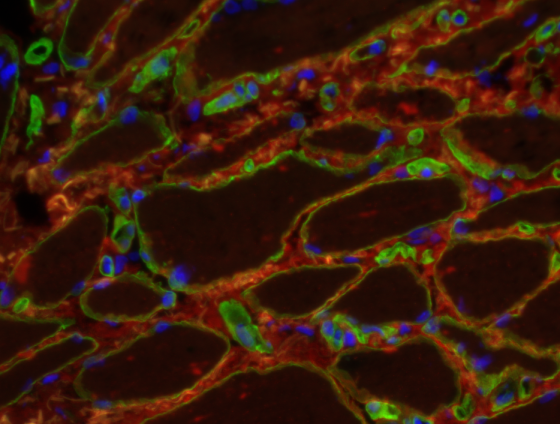
This option allows a systematic histogram selection between two user set values. Uncheck the channel(s) which must be preserved. This tools can gives the same results than non destructive arithmetic operations. Set minimum value is visually equivalent to subtract a constant, and set a maximum value is equivalent to divide the image by a constant. For example, set the values between 2000 and 31768 is equivalent to make the operation "Process->Math-> Subtract … 2000" and then "Process->Math-> Divide … 2" in a visual and none destructive mode.
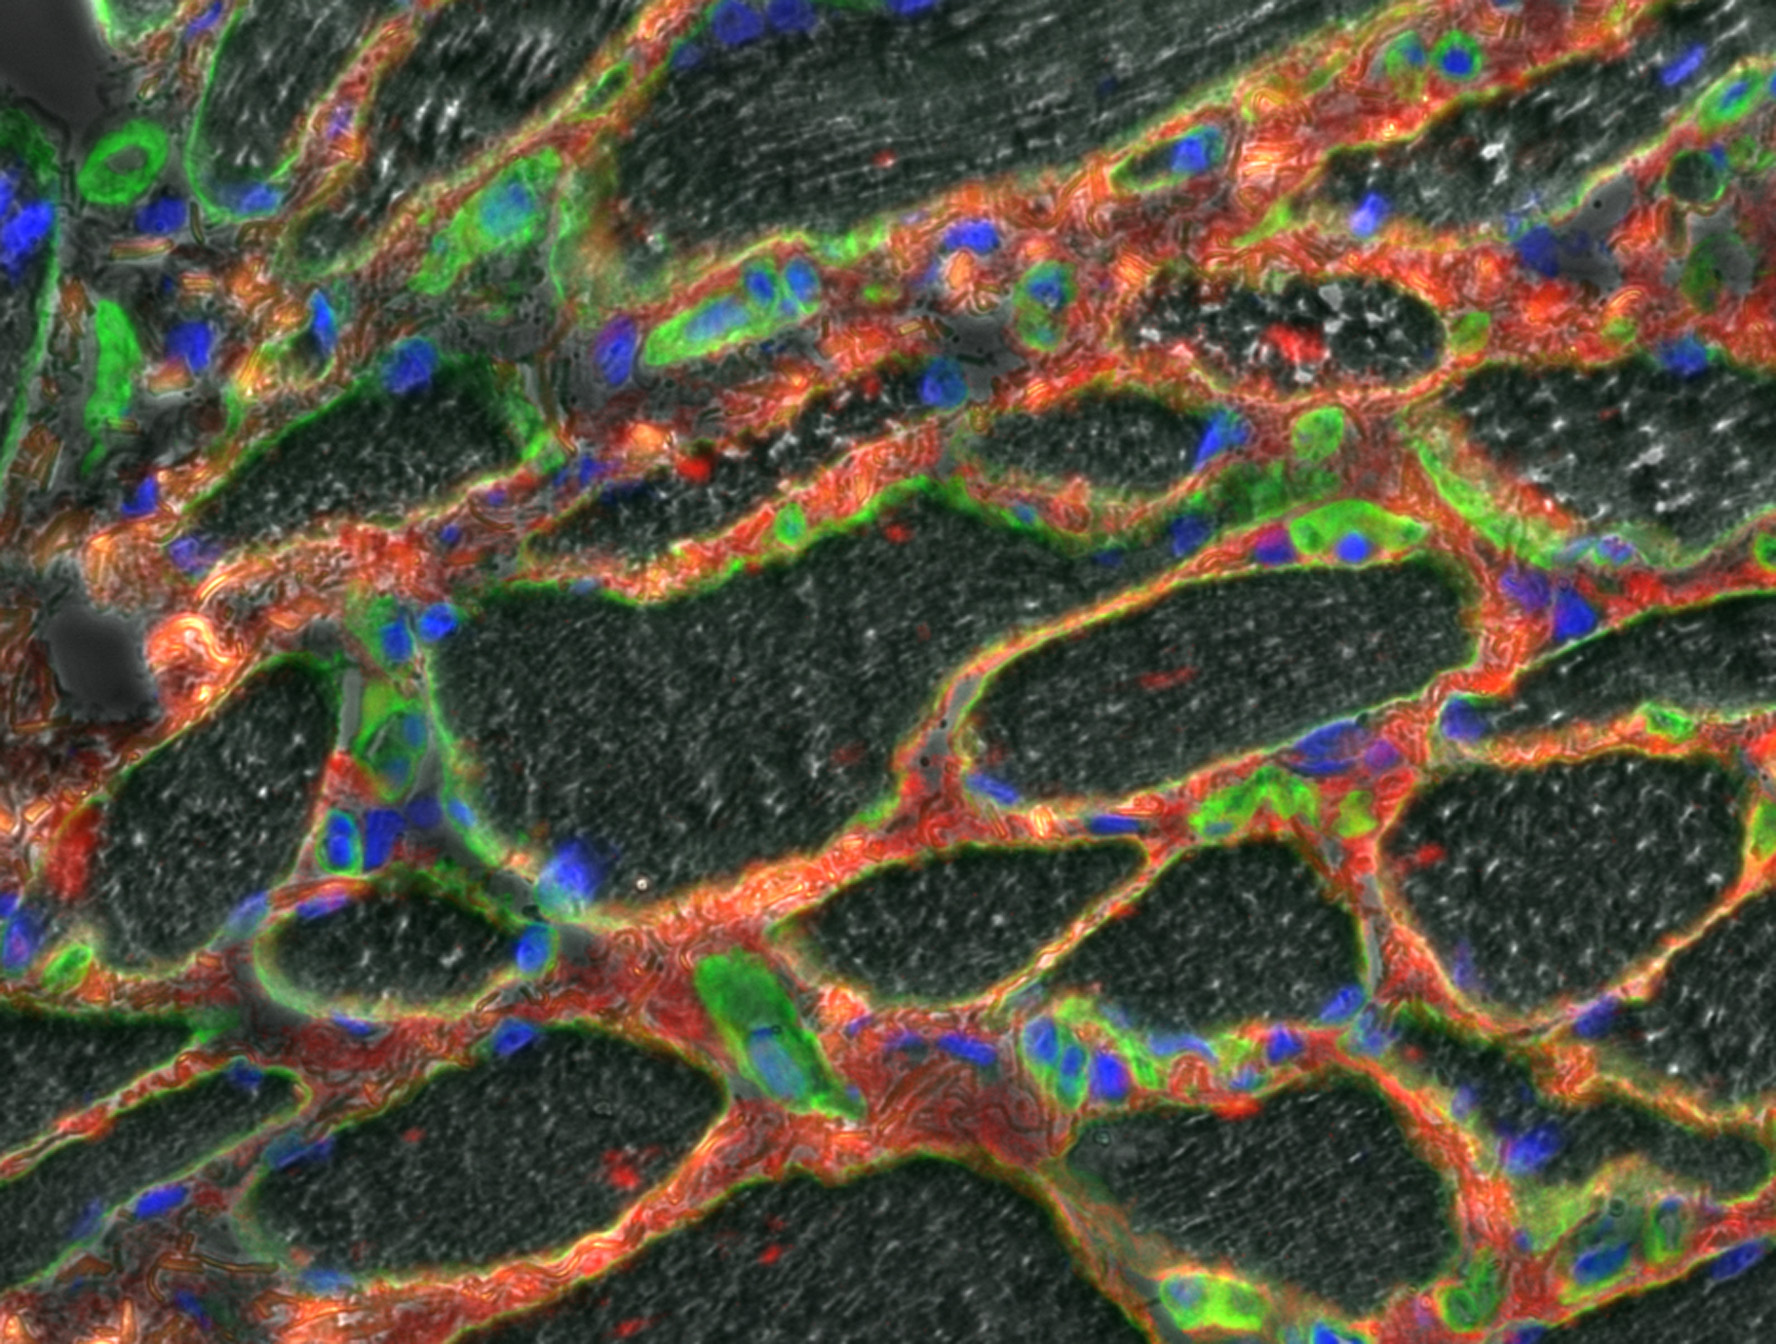
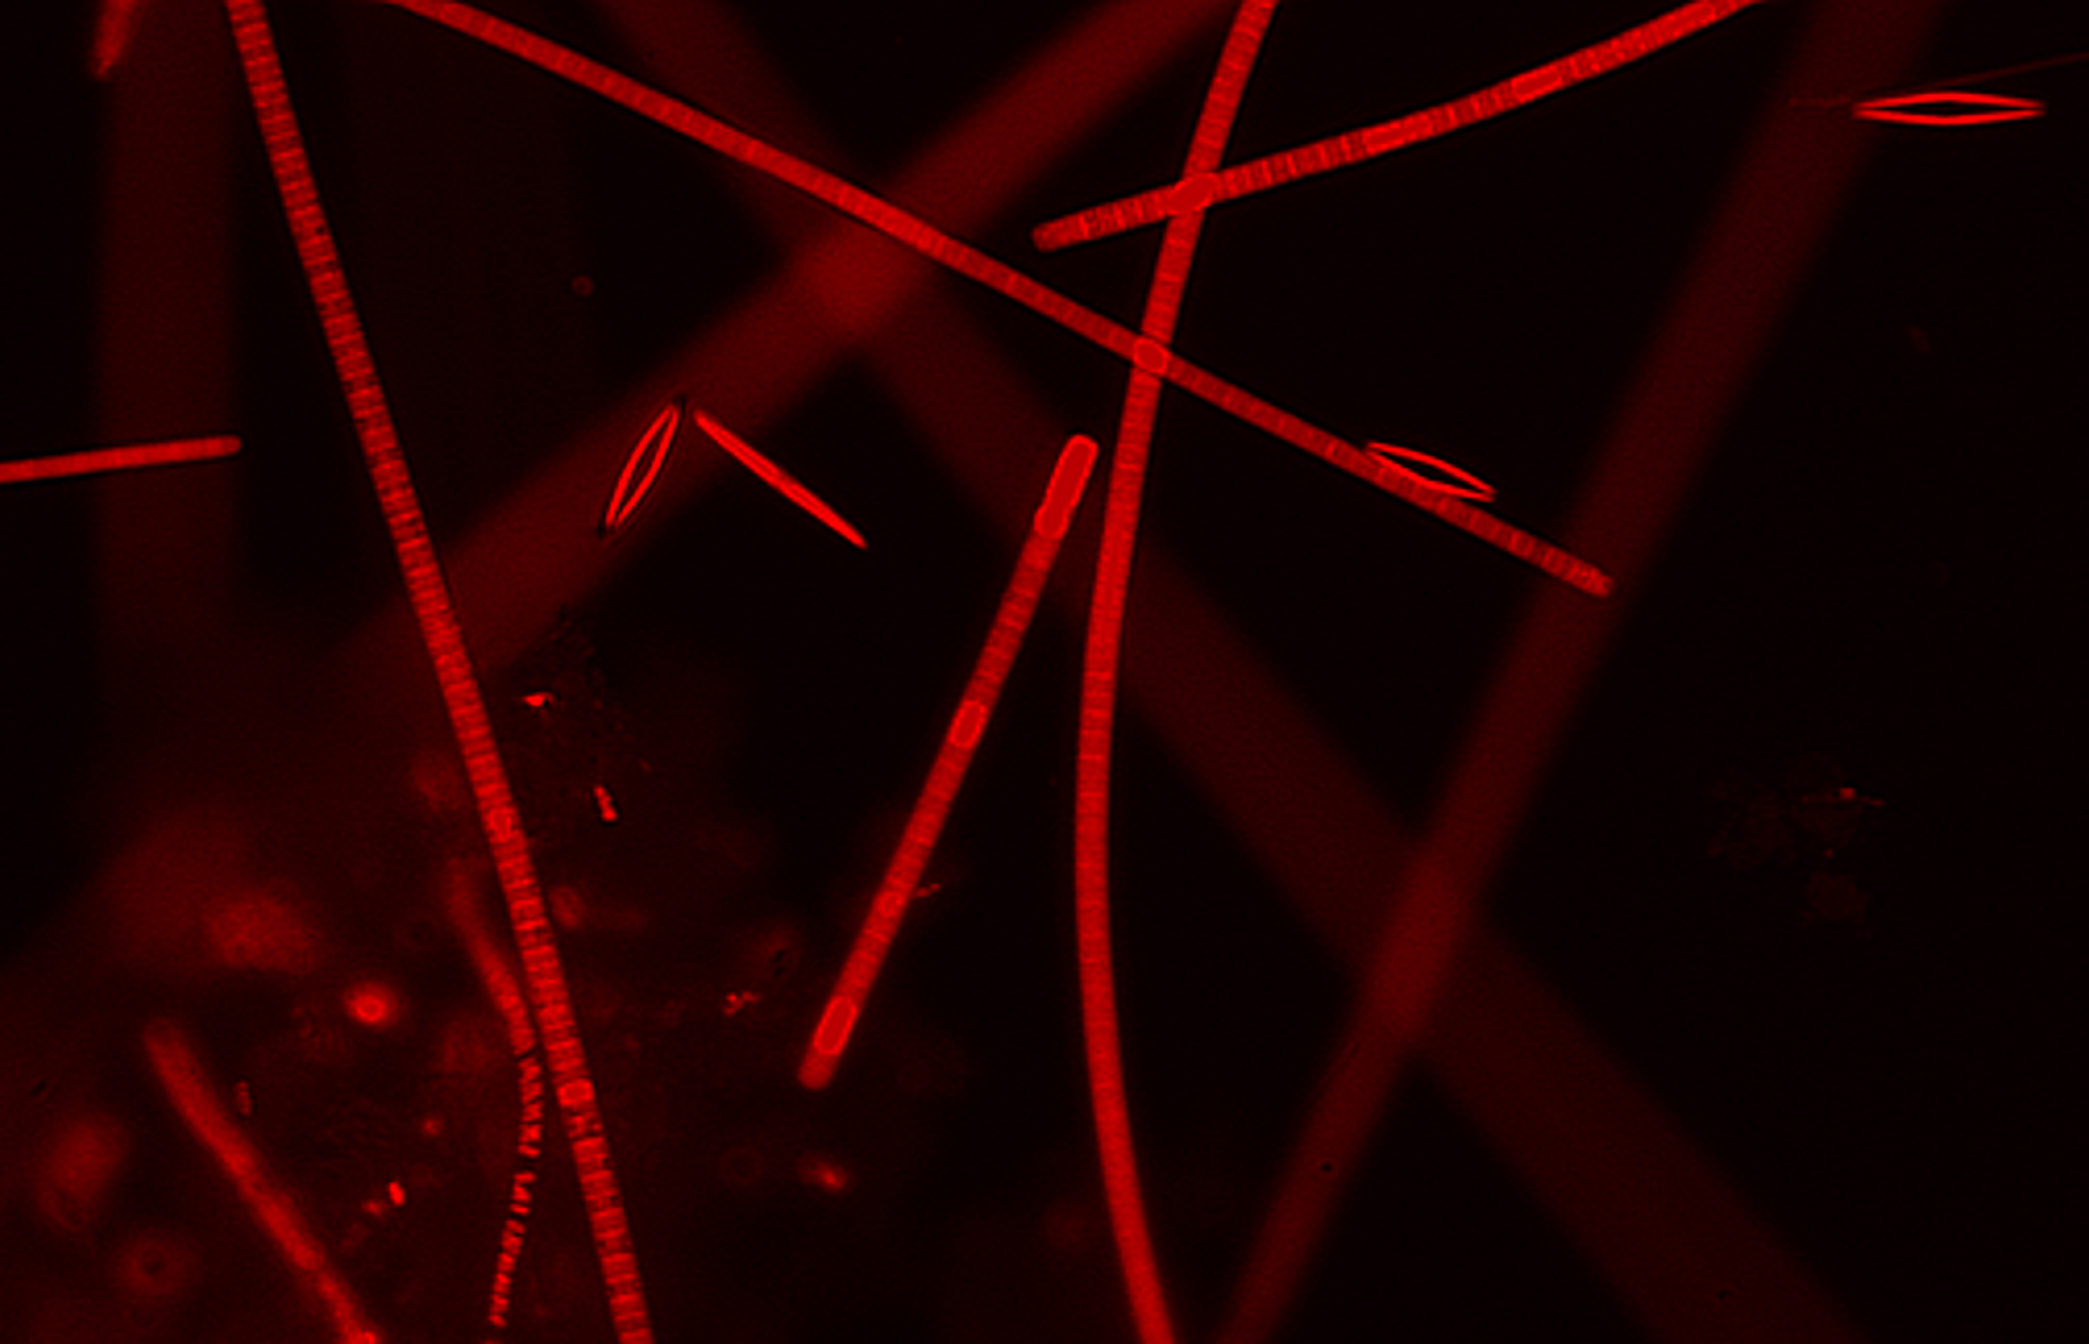
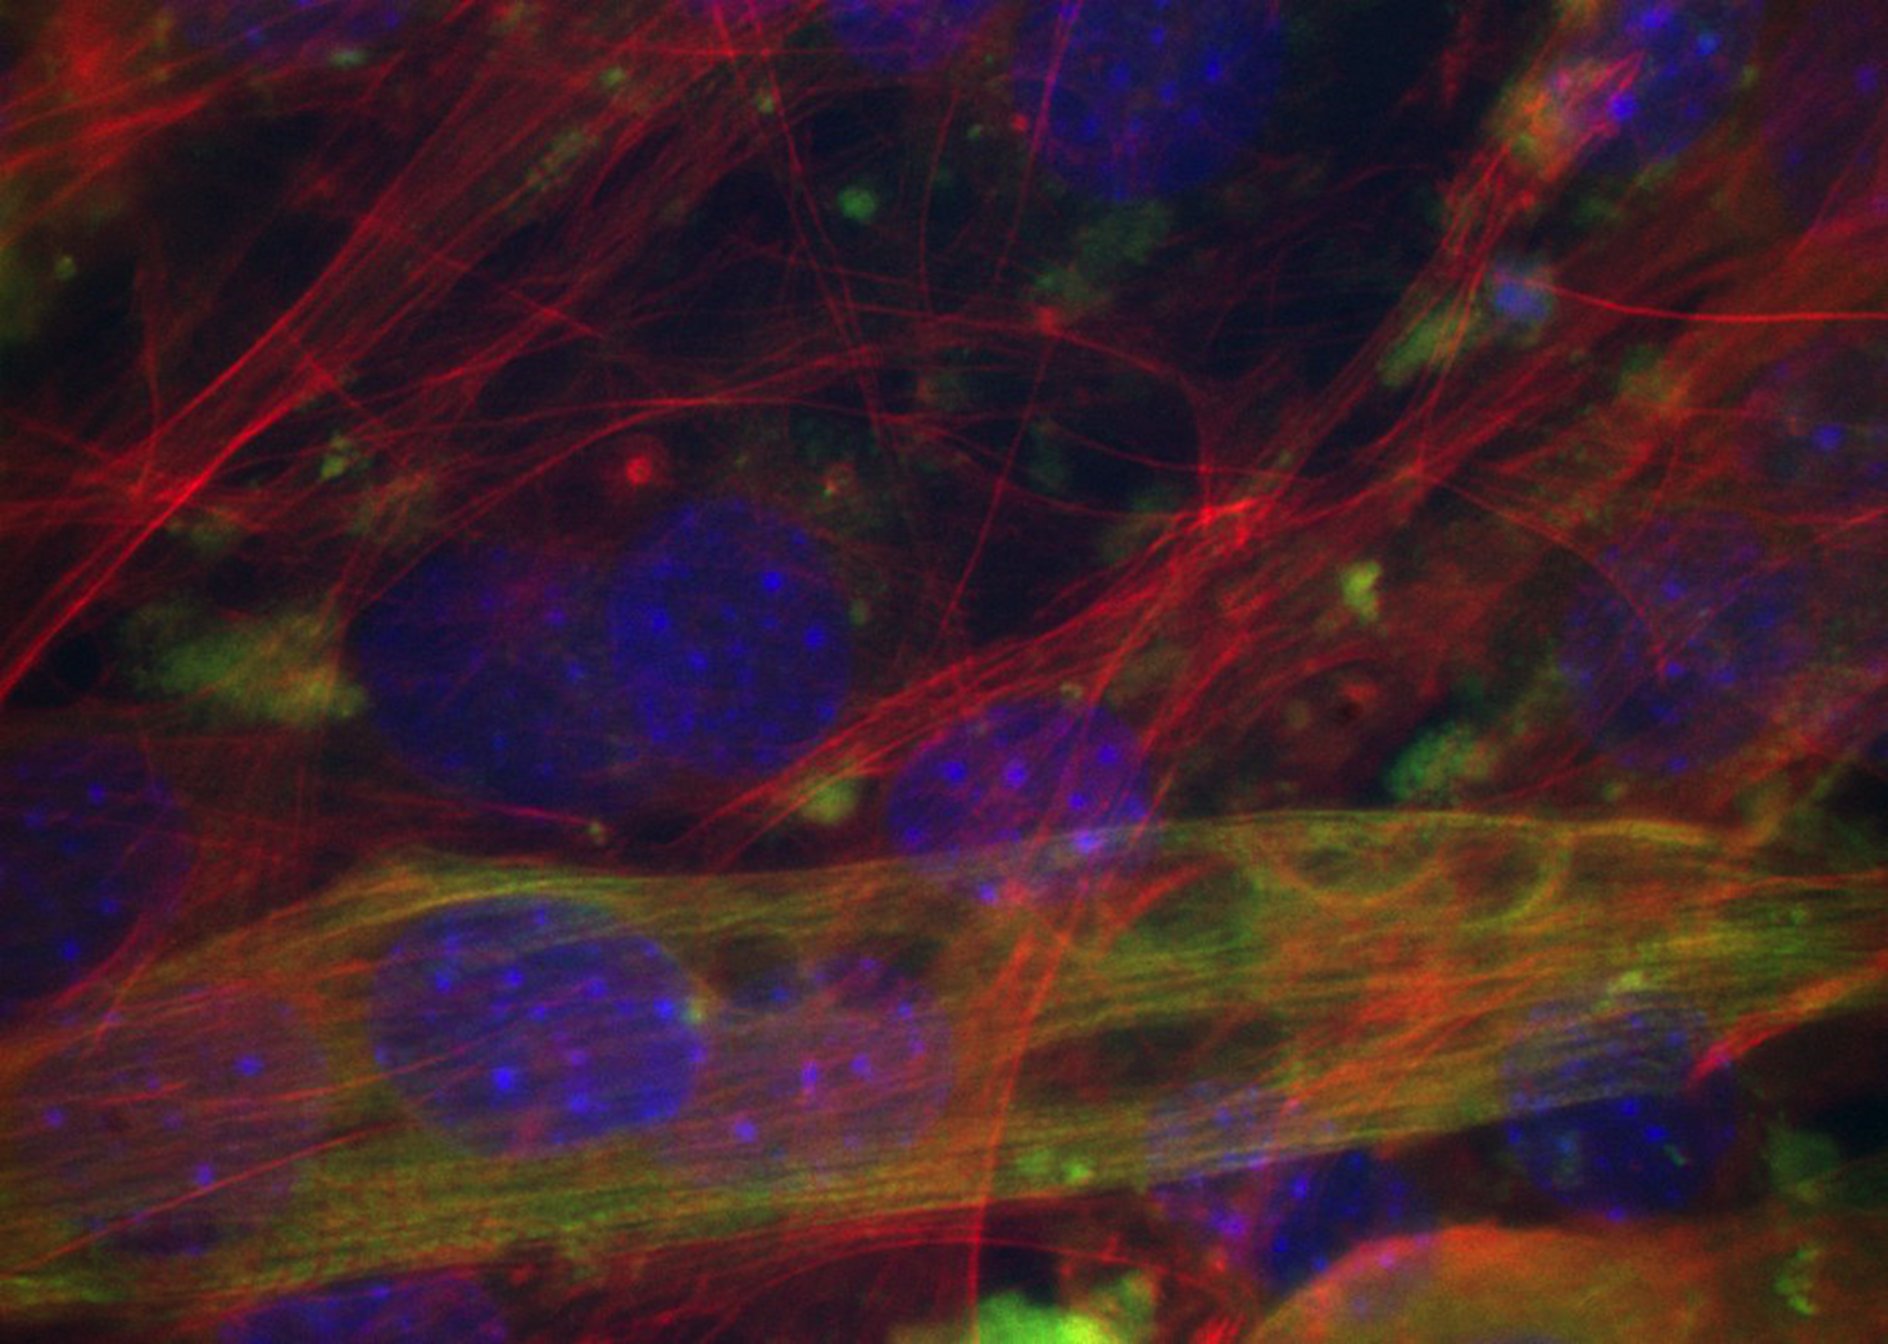
- Download the "HistoMuscle-4Channels" sample from the "On line Documentation & Demo Menu" tool:
 The tool downloads and opens a stack of four slices stored on the hard disk at the ".../ImageJ-64/Downloaded Demo Images/" repertory [4].
- Affect the correct colors (red, green, blue and grey, respectively) to each channel (see above for details):

- To remove the background of some channels and to optimize the lightning, choose the channels to treat and the limit values from the "Adjust Channel Levels" menu tool. In the example, the limits are set between the levels 5000 to remove the background, and 16000 for the lightning only for the red channel.
 See the result, with and without the phase contrast channel:

- Download the "HistoMuscle-4Channels" sample from the "On line Documentation & Demo Menu" tool:
- Summary for the results of this function - slide-show:


| prev | next |
- Adjust Channel Levels Menu- "between two set values"
This option allows a systematic histogram selection between two user set values. Uncheck the channel(s) which must be preserved. This tools can gives the same results than non destructive arithmetic operations. Set minimum value is visually equivalent to subtract a constant, and set a maximum value is equivalent to divide the image by a constant. For example, set the values between 2000 and 31768 is equivalent to make the operation "Process->Math-> Subtract … 2000" and then "Process->Math-> Divide … 2" in a visual and none destructive mode.