 LSM transmission deblurring for ImageJ §1 - Documentation:
Removing Streaks Settings
Principle and Examples:
Removal of artifactual horizontal stripes is performed using the Fast Fourrier Transform (FFT) function of ImageJ §1. This tool is an improvement of previous works made on ImageJ in that field (Rasband, [1]), (Carpentier, 2004 [2]).
Briefly: first, a fast Harley transform procedure is performed on the image to be treated, with swapping the quadrants of power spectrum (Bracewell, 1984 [3]). A filtering using a mask in the frequency domain is then performed. The vertical rectangular areas used as mask, are centred on the vertical axis of symmetry, and cover a user defined part of the spectrum. The inverse FFT is performed after using a gaussian transition (Carpentier 2004 [4]) as previously described (Reeves, 1990 [5]) and implemented in the NIH Image software (Rasband [6]). The final image is then free of horizontal periodic artefacts.
The settings of the removing streaks function are available from the "Removing Streaks With Custom Settings" sub-menu of the The "LSM Transmission and Phase Contrast Deblurring Menu" tool bar menu (see the following screen shot). These are also available by right
click onto an image (control click for Macintosh with
single button user interface device):


"Myoblast-sample" demo image:
Image containing "low", "medium" and a few "hight" frequency horizontal artefacts with "medium" amplitudes:
(download here to reproduce the treatment)
The dialog box shown in the following screen shot allows to adapt the filter to the kind of artefacts to be removed:
The three image treatments showed bellow, indicate how the horizontal and vertical size values
of the masks, and the sd value for the hight frequency filter gaussian
transition, can be adjusted to remove a large set of LSM horizontal
artefacts. Spectrum of power are showed, and image samples are
downloadable to reproduce the decribed image treatments.
"Myoblast-sample" demo image:
Image containing "low", "medium" and a few "hight" frequency horizontal artefacts with "medium" amplitudes:
(download here to reproduce the treatment)
 |
 |
 |
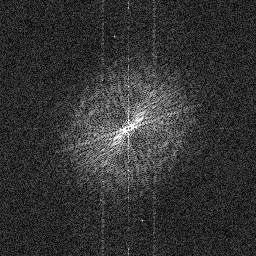
| "Myoblast-sample" initial image | Power spectra of the "Myoblast- sample" initial image | FFT mask with hight frequencies settings: 0.005 - 0.002 - 3.5 |
 |
 |
|
| Corrected image: the inverse FFT of the power spectra of the "Myoblast-sample" initial image after applying the FFT mask | Power spectra of the corrected image (enhanced by Process>Math>Gamma (4) and Image>Adjust>Brightness/Contrast (Auto)) | Half mask surface plot representation: yellow-white peaks correspond to the highest filtered frequencies along the half vertical axis of the power spectra |
|---|
"IJ-lsm-sample" demo image:
Image containing "hight" frequency horizontal artefacts with "medium" amplitudes:
(download here to reproduce the treatment)
Image containing "hight" frequency horizontal artefacts with "medium" amplitudes:
(download here to reproduce the treatment)
 |
 |
 |
| "IJ-lsm-sample" initial image | Power spectra of the "IJ-lsm-sample" initial image | FFT mask with hight frequencies settings: 0.3 - 0.05 - 0.8 |
 |
 |
 |
| Corrected image: the inverse FFT of the power spectra of the "IJ-lsm-sample" initial image after applying the FFT mask | Power spectra of the corrected image (enhanced by Process>Math>Gamma (4) and Image>Adjust>Brightness/Contrast (Auto)) | Half mask surface plot representation: yellow-white peaks correspond to the highest filtered frequencies along the half vertical axis of the power spectra |
"Cell-vacuoles-sample" demo image:
Image containing "hight" frequency horizontal artefacts with "hight" amplitudes:
(download here to reproduce the treatment)
Image containing "hight" frequency horizontal artefacts with "hight" amplitudes:
(download here to reproduce the treatment)
 |
 |

|
| "Cell-vacuoles-sample" initial image | Power spectra of the "Cell-vacuoles-sample" initial image | FFT mask with hight frequencies settings: 0.35 - 0.4 - 3.5 |
 |
 |
 |
| Corrected image: the inverse FFT of the power spectra of the "Cell-vacuoles-sample" initial image after applying the FFT mask | Power spectra of the corrected image (enhanced by Process>Math>Gamma (4) and Image>Adjust>Brightness/Contrast (Auto)) | Half mask surface plot representation: yellow-white peaks correspond to the highest filtered frequencies along the half vertical axis of the power spectra |
References:
- [ref 1] Rasband W. ImageJ Documentation: FFT Filtering & FFT Filtering, Part II.
- [ref 2] Carpentier G. FFTRemoveStreaks macro for removing interference streaks from confocal images. ImageJ News. 4 November 2004, v1.33o.
- [ref 3] Bracewell, R.N., The Fast Harley Transform, Proc. IEEE. Vol. 72, N°8, 1984.
- [ref 4] Carpentier G. GaussianConvolution macro, which does image smoothing using a custom Gaussian matrix. ImageJ News. 7 December 2004, v1.33s.
- [ref 5] Reeves A.A. Optimized Fast Hartley Transform for the MC68000 with Applications in Image Processing. Master of Science Thesis, Thayer School of Engineering. Dartmouth College Hanover, New Hampshire, 1990.
- [ref 6] Rasband W. NIH Image program: developed at the U.S. National
Institutes of Health and available on the Internet at
http://rsb.info.nih.gov/nih-image/
- [ref 7] Carpentier G. LSM Transmission Deblurring toolset. ImageJ News. 22 December 2006, v1.38f.
- "Myoblast-sample" demo image source: see the code of the "FFTRemoveStreaks" macro at this link. Device for the image acquisition: Zeiss LSM-410.
- "Cell-vacuoles-sample" demo image from the courtesy of Xiaoli Yue. Device for the image acquisition: Olympus LSM FV500.
- "IJ-lsm-sample" demo image from the ImageJ documentation [1].
§1 ImageJ (http://rsb.info.nih.gov/ij/) is a public domain Java image processing program inspired by NIH Image for the Macintosh. It runs, either as an online applet or as a downloadable application, on any computer with a Java 1.1 or later virtual machine. Downloadable distributions are available for Windows, Mac OS, Mac OS X and Linux. The author, Wayne Rasband (wayne@codon.nih.gov), is at the Research Services Branch, National Institute of Mental Health, Bethesda, Maryland, USA.
Page author: Gilles Carpentier. Address: Gilles Carpentier, Faculté des Sciences et Technologies, Université Paris 12 Val-de-Marne, France.
- Special thanks to Alessandra Albano for the English correction of this page.

---