Computer Data Acquisition for Biochemistry Practice Works
This page describes
an easy method to make numerical data acquisition from an analogic UV
chromatographic monitor. A computer acquisition presents numerous
advantages compared to the use of a paper chart recorder of
chromatographic profiles. For example, there are no constraints of
scaling the speed of paper and the mv/cm scale of the records. The
profiles can be rescaled after acquisition, and converted into
elution volumes unit in a tabloid like Excel, making easy the
comparison of elutions charts.
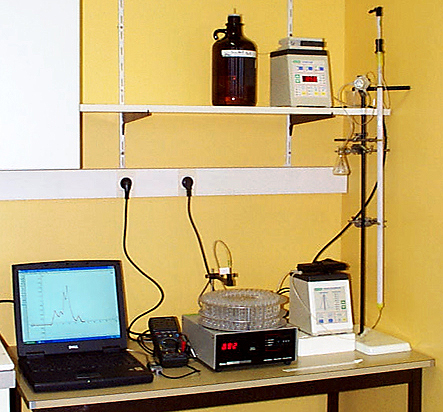
The following
picture shows a chromatographic montage. On the top, from left to
right; the tank of buffer elution (Tris 50 mM, NaCl 125 mM, pH 7.5),
a peristaltic pump setting a theoretical flow rate of 0.5 ml/min, a
sample injection valve with a loading loop of 250 µl, and a
chromatographic column (75 cm x 1.5 cm) filled with a Sephacryl
S-200-HR gel. On the bottom, from right to left; the UV monitor, a
fraction collector, a Metex
M-3850D multimeter connected to the 0-1V analogic output of the UV
monitor, and a RS-232 to USB adaptor connecting the computer to the
RS-232 output of the multimeter.
The next picture shows a close view of the multimeter, the RS-232 to USB adaptor and the computer recording an elution profile. Datalyse can record 3000 points in RAM memory. The screen on the picture shows a record of about 5 hours with a recording step of one measure every 15 seconds. In such conditions Datalyse allows to make records of 12.5 hours.
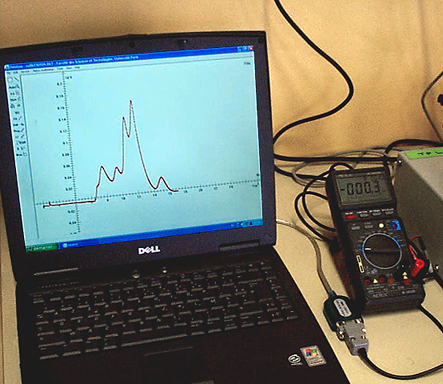
The autonomy of a multimeter is very variable, depending essentially on the RS232 interface energy consumption. For example, for the montage described above with the Metex multimeter, with a full charged rechargeable Nimh battery (150 mA/h), the acquisition autonomy is about 17h.
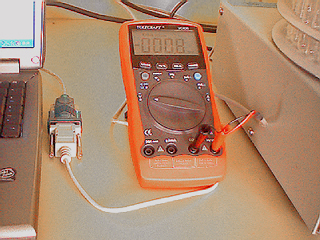
The following montage, using a Voltcraft VC820 multimeter with an optical RS232 interface, allows to obtain a 6 days continuous recording with the same kind of rechargeable battery:
 ----------
Some
few data about the principle of molecular exclusion chromatography
more usually called gel filtration chromatography:
Briefly, gels composed of porous particles, like gel beads of reticulated polymers, are known to have the ability to separate molecules according to their size. The gel is a stationary phase through which a solvent, the mobile phase, runs out. During the elution of a loaded sample, small molecules can enter freely in the matrix of the beads, and are retained whereas big molecules are excluded from the beads and are eluted without being retained. Some intermediate molecules enter more or less in the matrix, and are delayed according to their sizes compared to the excluded big molecules. Gels are characterized by their molecular mass fractionation domain.
In the present example, the gel has a fractionation range from 5000 g/mol to 250 000 g/mol (molecules assumed to be globular proteins).
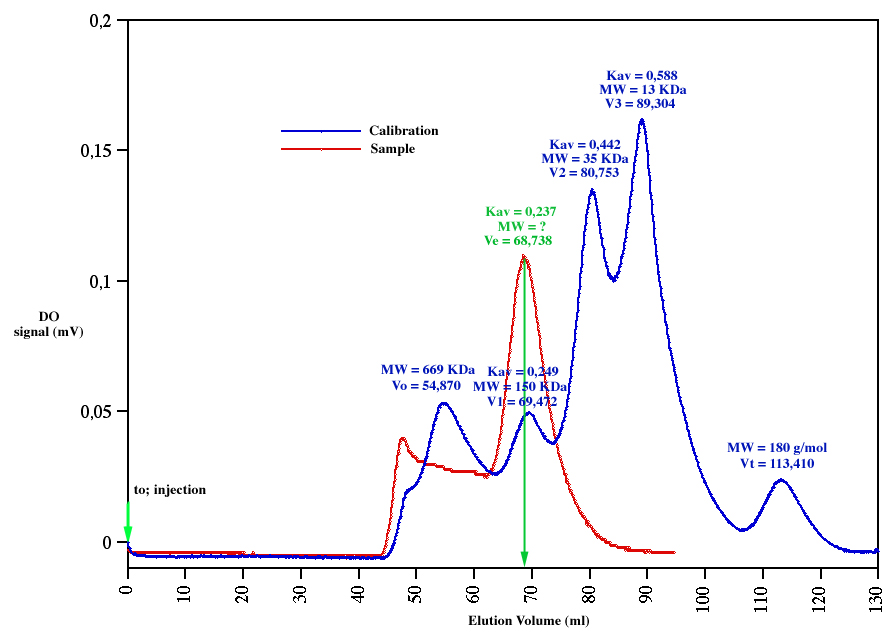
A chromatogram is characterized by three different kinds of elution volumes:
- The elution volume of excluded molecules, measured by loading a very high molecular weight protein (for instance) onto the chromatographic column, is called the void volume (Vo).
- The elution volume of a very small molecule which enter freely in the matrix of the gel, obtained by loading a salt or very small organic molecule, is called the total volume bed (Vt).
- The elution volume of the a molecule (protein for instance) which is in the fractionation range of the gel is Ve.
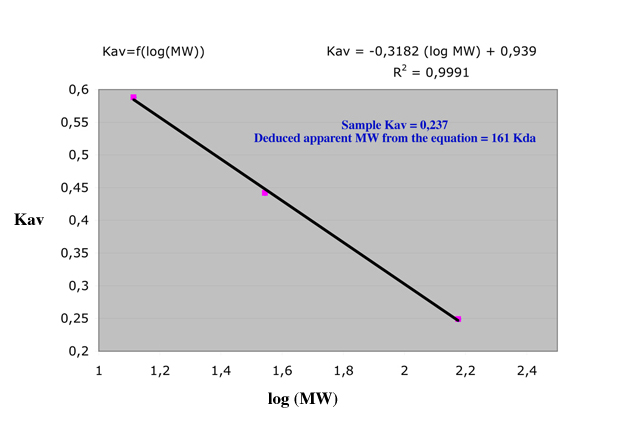
There is a linear
relation between the logarithm of the molecular weight of the protein
and a ratio, called Kav, defined as Kav=(Ve-Vo)/(Vt-Vo).
By loading a
set of known molecular weight (MW) proteins, this relation allows to
calibrate a column by measuring Vo, Vt and different Ve.
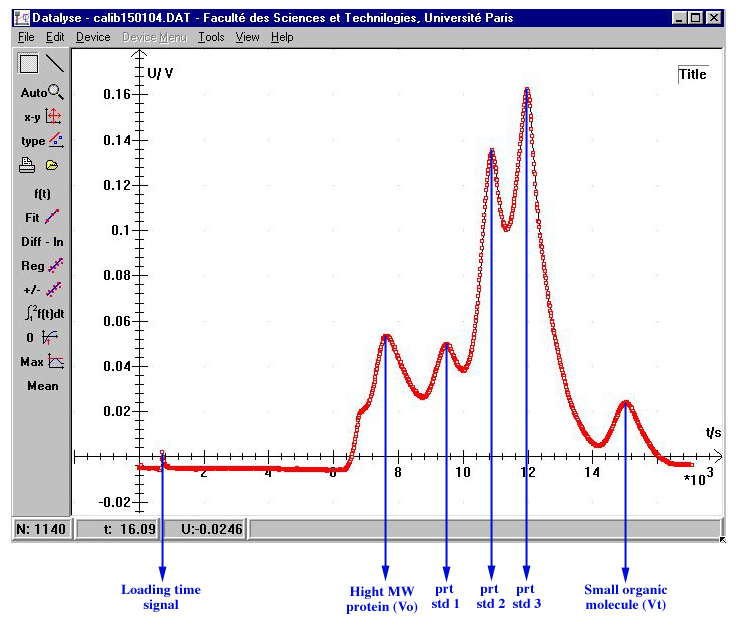
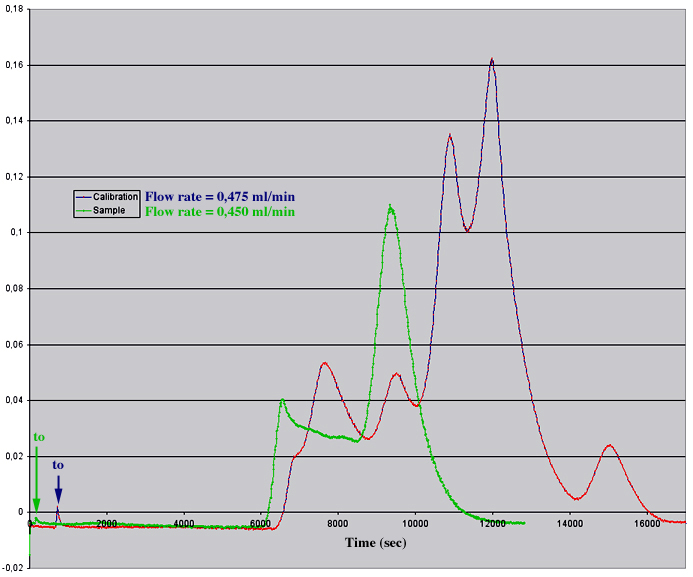
The following example shows a Datalyse recording of an elution profile of a cocktail sample allowing to calibrate a column in a single step.
Special thanks to Alessandra Albano for the
English correction of this page.
Many thanks to Drs M.C. Bourin, E. Petit and K. Haupt for their precious advices in chromatography methodology.
Datalyse web site: http://www.datalyse.dk/datauk/
Address: Gilles Carpentier, Faculté des Sciences et Technologies, Université Paris 12 Val-de-Marne, France.
Gilles Carpentier web site: "Computer Data Acquisition for Biochemistry Practice Works: Methods and Examples"
