Table of contents
- Description, p1
- Installation, p2
- Documentation, p3
- Tutorial, p4
- Video Tutorials, p5
- References, p6
- Code, p6


Documentation:
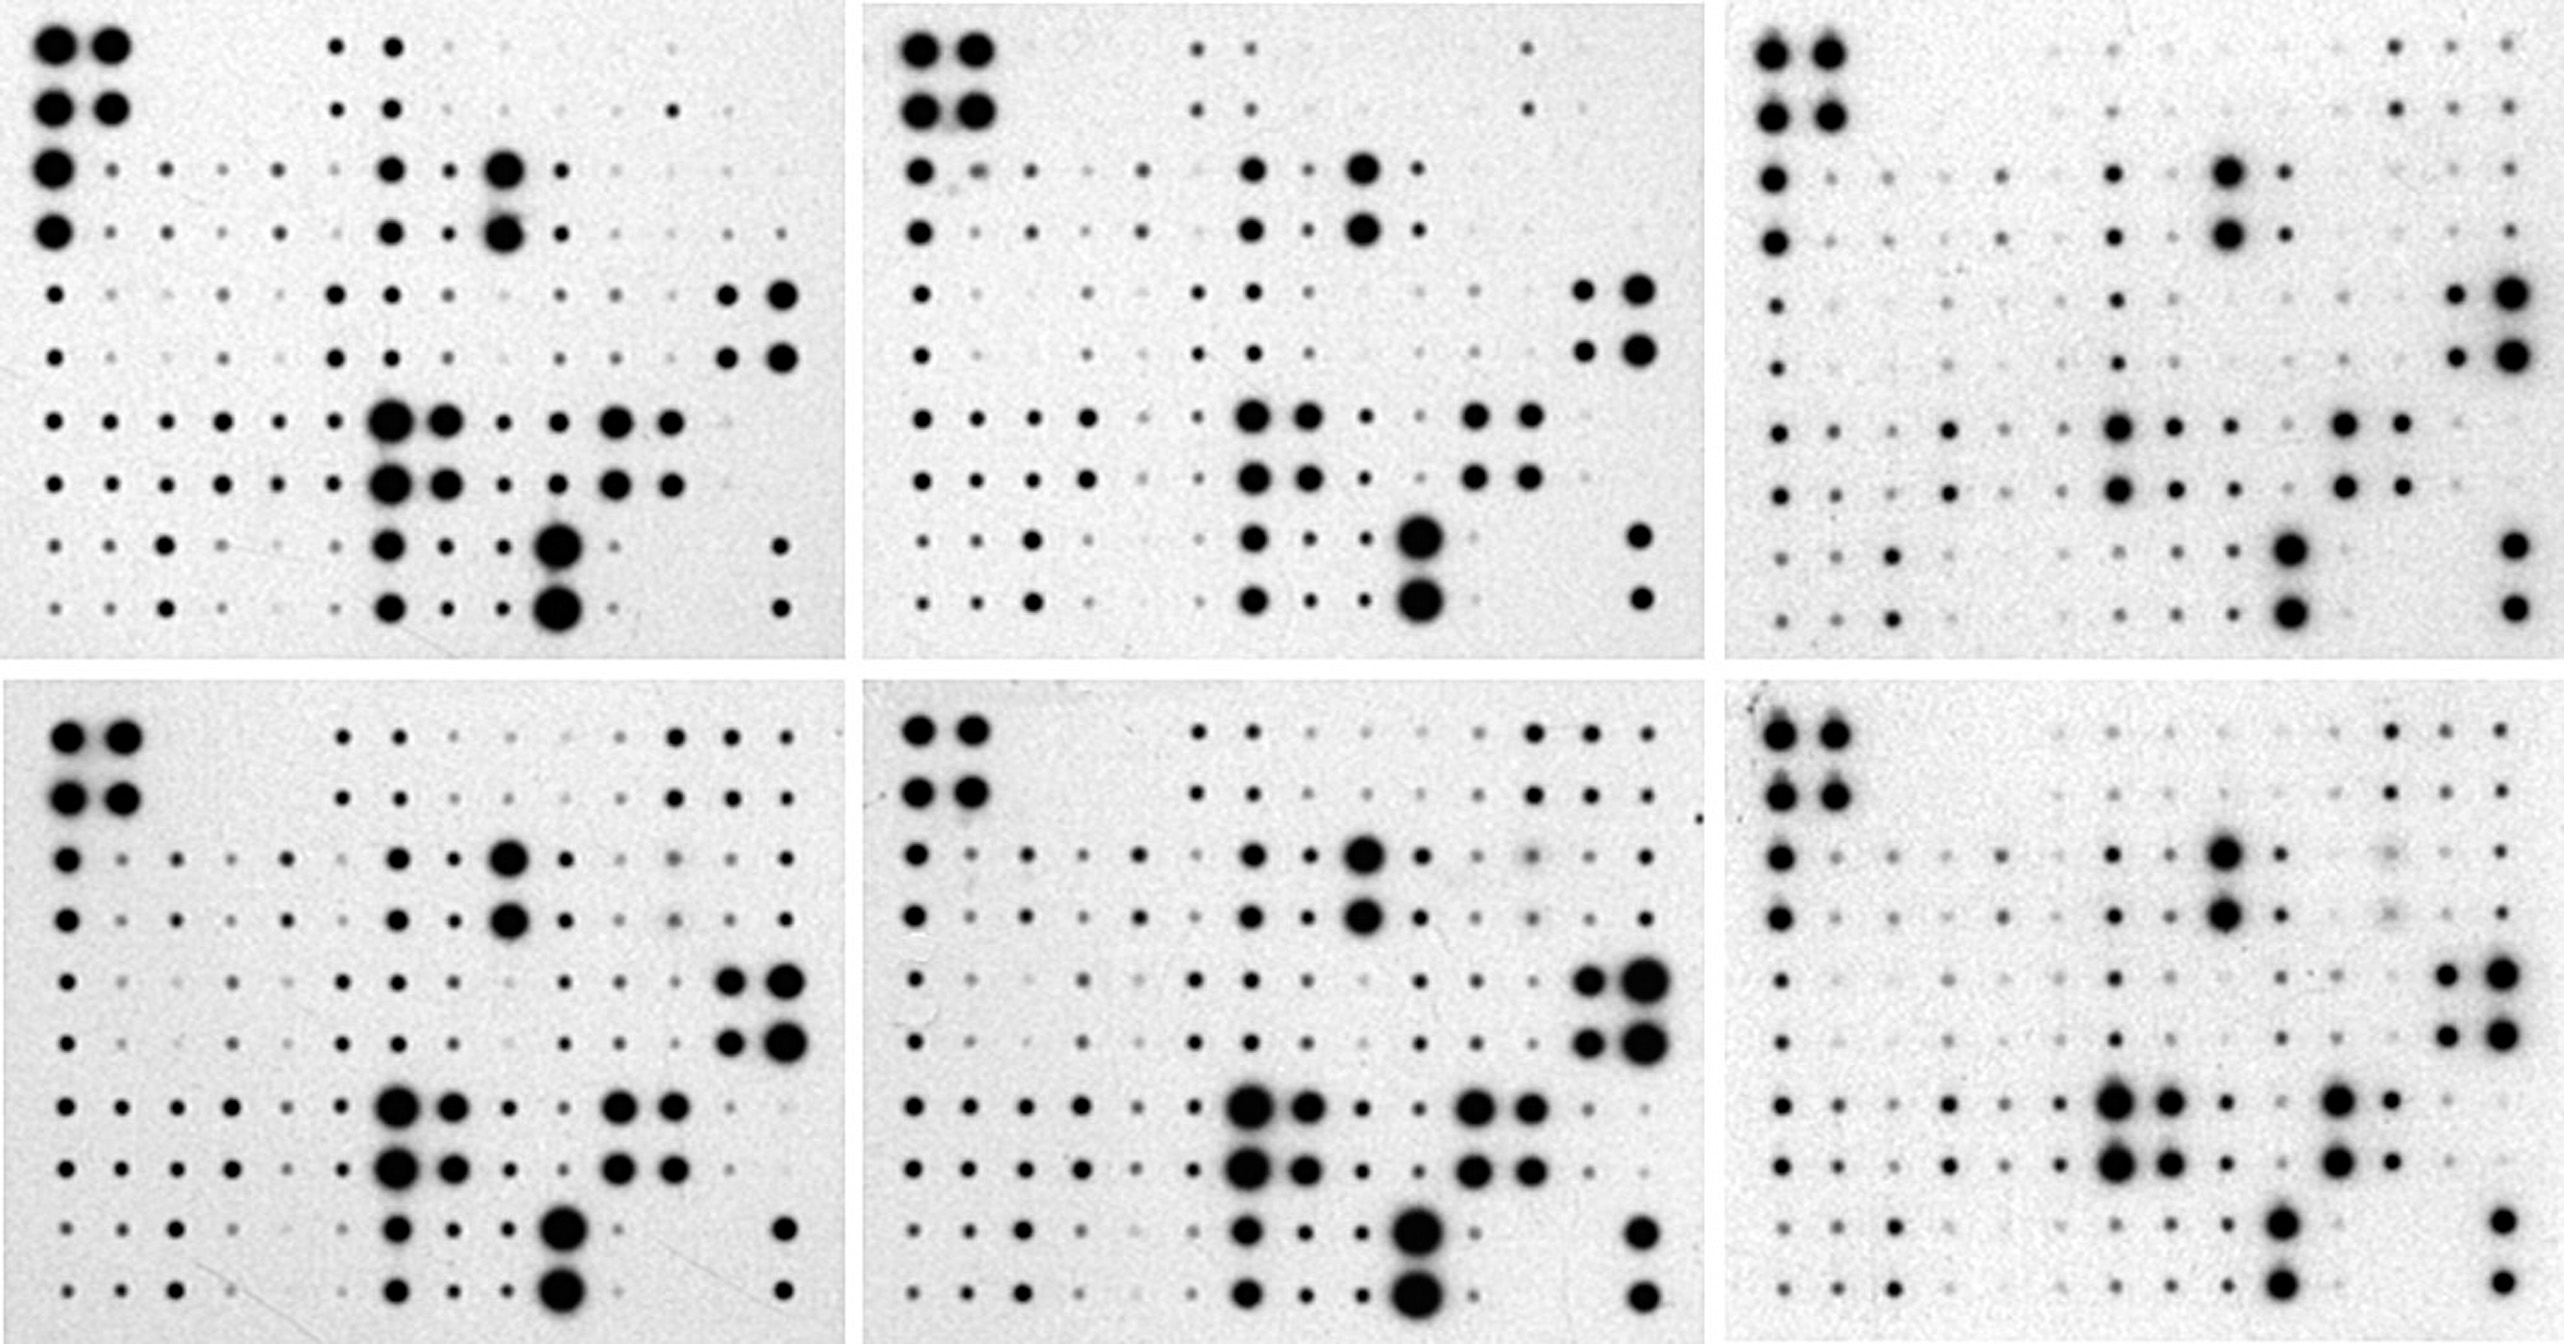
The analysis of a set of protein array images must be performed in two steps. The first step consists in analysing every single array, and the second one, into building master tables of measured values and the associated master modelled images grouping the data of the single analysis. It is then possible to input some internal references to normalize the tables and visual representations. A set of demo images and a table are provided through the internet resources to test the program (see the "On Line Documentation & Demo" below).
-
"Array Analysis Menu"
Regroups analysis functions of single protein array images:

- "Array Analysis" displays the graphical interface required to analyse an opened protein array image.
- "Save Results Documents" saves every document concerning one analysis (model, tabs, images) into a folder at the user choiced master repertory.
- "Save Results Documents at Image Location" saves every document concerning one analysis (model, tabs, images) into a folder placed at the protein array image repertory.
- "Close Results Documents" closes every document concerning one analysis (models, tabs, images).
-
"Group Pattern Menu"
Regroups tabs and analysed images management functions:

- "Masterize from Analysis Repertories" allows to user to choose a repertory containing some protein array analysis folders which will be summarized into master table and modelled images.
- "Import Master Table" imports a user selected, previously saved master table, and builds the corresponding master modelled image.
- "Draw "Master - Initial"" draws the master modelled image corresponding to an opened master table, using the maximum value of each array as normalization (it corresponds to the initial aspect returned by the "Array Analysis" item).
- "Draw "Master - Normalized"" calculates the normalized master table and draws the master modelled image corresponding, from an opened master table, using the current normalization options.
- "Set Internal Control and References" opens a dialog box to set up to 4 controls and 4 references. When more than one control or reference are choosen, the mean value is used for normalization.
- "Master Options Settings" menu:


- "Number of columns for the master images" sets the number of columns in which are arranged the modelled protein arrays. The initial setting optimizes this value to the size of the screen and the protein array number.
- "Normalization method" allows to choose between 3 methods of normalization:
- "Normalize according to the min/max of the master".
- "References used as global normalization of the master": normalizes using specified spots in the master choosen by the "Set Internal Control and References" menu. Specified spots are used for all the master values. Normalized dots display is optimized in the color scale according to the min/max value of the normalized master.
- "References used for normalization of each array of the master": normalizes using specified spots in the master choosen by the "Set Internal Control and References" menu. Selected spots are used in each individual modelled protein array. Normalized dots display is optimized in the color scale according to the min/max value of the normalized master.
- "Show master with max array normalization (initial representation)" activates-deactivates the systematic display of a master image presenting the protein array models in their initial aspects (individual normalization according the max value of each array).
- "Show dots limits on master" activates-deactivates the automatic entourage of spots by a grey circle.
- "Show internal references on master" activates-deactivates the labelling of the choosen internal control and references in cyan (control(s)) and green (reference(s)).
- "Save Master Documents" saves every document concerning one analysis (master tables and images) into a folder at the user choiced repertory.
- "Save Master Documents at Parent Folder Location" saves every document concerning one analysis (master tables and images) into a folder placed at the parent repertory of the masterized protein array analysis.
- "Close Master Documents" closes all documents concerning one analysis (master tables and images).
-
"Abort Process"
Click on this ImageJ tool bar icon to cancel demo downloading or erase the palette’s cursor.

"On Line Documentation & Demo Menu"
On line ressources: documentation, demo images of protein arrays and dot blot from different sizes and a master table for training (see "Tutorial" section).

"About"
Click on this ImageJ tool bar icon to get a short off line documentation.

"Version and Update Infos"
Click on this ImageJ tool bar icon to look for new versions.