Table of contents
- Description, p1
- Installation, p2
- Documentation, p3
- Tutorial, p4
- Video Tutorials, p5
- References, p6
- Code, p6


Tutorial:
Get the demo images:
This section shows how to analyse a set of protein array, using the demo images available online for training.
- Download the demo Images by the "On Line Documentation & Demo Menu" -> "Download/Open a Set of 6 Demo Protein Array Images" menu.

 The tool downloads and opens 6 images stored on the hard disk at the ".../ImageJ-64/Downloaded Demo Images/ProteinArrayDemo" repertory.
- Download the demo Images by the "On Line Documentation & Demo Menu" -> "Download/Open a Set of 6 Demo Protein Array Images" menu.
Step 1 - single image analysis:
- Choose one of the 6 images, and start an analysis using the "Array Analysis Menu" -> "Array Analysis" function.
 This action proposes a method of background subtraction (keep default settings), and builds a graphical interface for the dot matrix analysis.
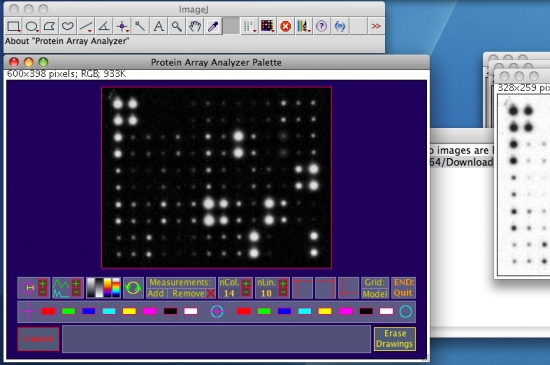
- Optimize the visualization by activating some options available from the graphical interface (as examples see the white oval marks on the figure below). For more details on the graphical interface functions, see this web page.
 Above: from left to right, the selected functions perform an autosetting of the cursor’s diameter by object analysis, a strech of the preview histogram, and finally, the third one applies the "Fire" Look Up Table (LUT).
- Set the three required dots forming angle (hight-left, hight-right and low-left) using the three green cross hair icones (circled in white in the figure below). To set a mark, click on a cross hair icone and drag the cursor keeping clicked. Marks can be adjusted, by re-selecting the appropriate cross hair symbol (red cross hair: mark to set, green cross hair: set mark, yellow cross hair: mark in setting).
 Above: the hight-right mark is set, the hight-left is in adjusting mode.
Once the third marks is set, a grid is drawed, and the matrix of selections is measured automatically as a table of values like shown below. It may be necessary to change size of the cursor (use +/-) if the "auto-size" is not compatible with the number of lines and columns. Click on "Model" area (white marked) to get a modelled image of the array.
Above: the hight-right mark is set, the hight-left is in adjusting mode.
Once the third marks is set, a grid is drawed, and the matrix of selections is measured automatically as a table of values like shown below. It may be necessary to change size of the cursor (use +/-) if the "auto-size" is not compatible with the number of lines and columns. Click on "Model" area (white marked) to get a modelled image of the array.
 End the analysis by clicking on the area "End Quit", save the result documents at the image location, and close the documents (see screen shots below).
 The analyzer records every document concerning the analysis in a folder (named with the suffix "Results Documents") placed in the parent repertory of the original image. The tab file with the suffix "Grid Measurements Table" will be used in the next step for the building of the master images and tables grouping the single analysis results (figure below).
 Proceed in the same manner for the other images.
- Choose one of the 6 images, and start an analysis using the "Array Analysis Menu" -> "Array Analysis" function.
Step 2 - masterize single array analyses:
Once arrays are individually analyzed using the "Array Analysis" tools, the "Group Pattern" menu then allows to obtain a global view of a set of arrays.
- Select the parent folder containing the array analyses by the "Masterize from Analysis Repertories" function:
 Below: the selected folder containing the demo array analysis. This function looks for result tables coming from the "Array Analysis" functions, in the parent folder chosen by the user. The tool explores any sub-levels, and builds a master image, or pattern, associated to a master table prensenting all the found results.
It is so possible to obtain a global panel of all the arrays of a set of experiments by a simple click.
Below: the selected folder containing the demo array analysis. This function looks for result tables coming from the "Array Analysis" functions, in the parent folder chosen by the user. The tool explores any sub-levels, and builds a master image, or pattern, associated to a master table prensenting all the found results.
It is so possible to obtain a global panel of all the arrays of a set of experiments by a simple click.
 The program exibits two default master representations:
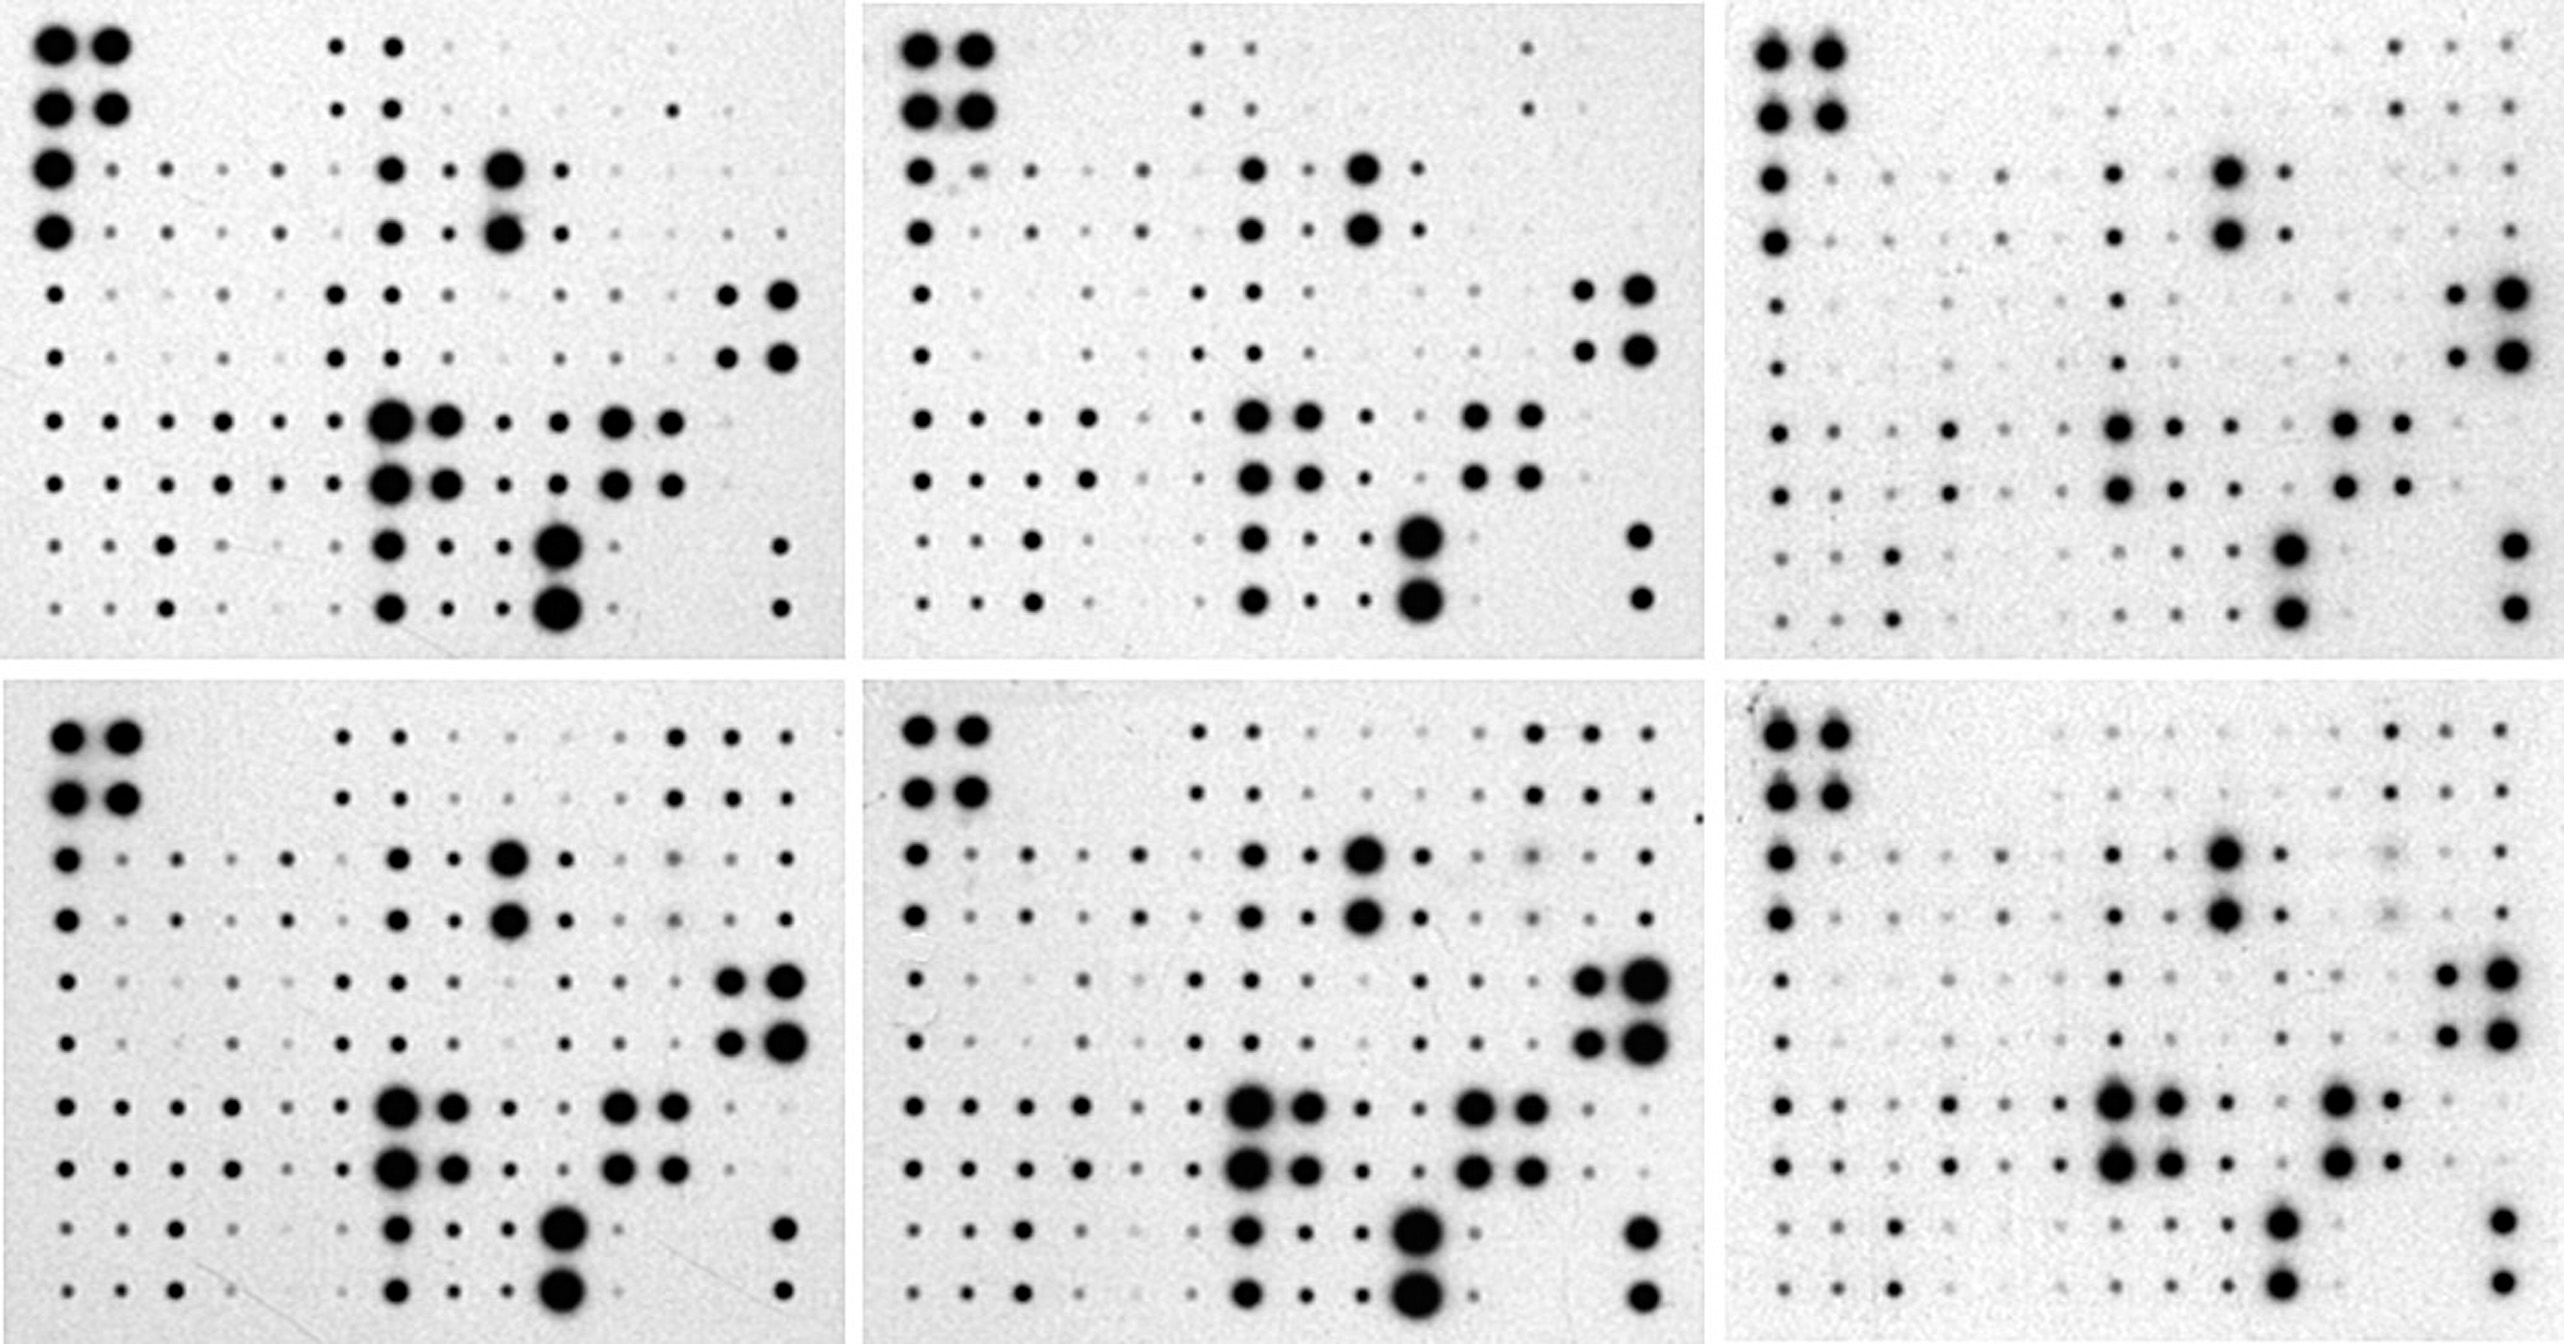
 The default master pattern (above left) presents the arrays as they came from the analysis, with the visualization scaled between zero and the maximum values encountered in each array. The initial normalized pattern (above right) presents a normalization between zero and the maximum value found in the master. This representation gives the most natural aspect of the modelled pattern compared to the initial images. It can be used to estimate visually the global intensity of an array among the group.

- Normalize the masters using the internal references provided by the manufacturer by using the "Group Pattern Menu" -> "Set Internal Control and References" function.
 For this demonstration, "RayBio Mouse Cytokine Array 3" [4] were used. These membranes allow the detection of 62 cytokines. For the normalization of this demonstration analysis we will use as positive dots the A1, A2, B1, B2, and as blank or control the dots L9, L10, M9, M10.
 Above, the dialog box allows to enter or supress some internal references for the normalization. When more than one control or reference are input, the mean value is used for calculations.
Each value is normalized following this formula : Dot Value norm = (Dot Value - mean(Controls))/mean(References).
The master pattern is refreshed each time the references are changed. Below, the aspect when all the choosen references are taken into account. Note that the representation puts in evidence the highest relative intensity in the array number 5 (right below).
Above, the dialog box allows to enter or supress some internal references for the normalization. When more than one control or reference are input, the mean value is used for calculations.
Each value is normalized following this formula : Dot Value norm = (Dot Value - mean(Controls))/mean(References).
The master pattern is refreshed each time the references are changed. Below, the aspect when all the choosen references are taken into account. Note that the representation puts in evidence the highest relative intensity in the array number 5 (right below).
 Save the documents by using the "Group Pattern Menu" -> "Save Master Documents at Parent Folder Location" function.

 Above: a folder with master images and tables is recorded at the parent analysis repertory. The table files are compatible with your favorite spreadsheet software. For OpenOffice, during the opening process, select all the values from the preview and affect the "Standard" type (see below).
 The window is ready for calculations and histograms.

- Select the parent folder containing the array analyses by the "Masterize from Analysis Repertories" function: